
Concept explainers
Videos
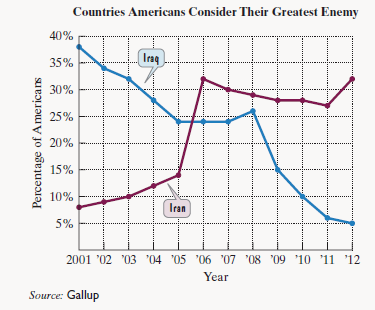
According to a Gallup poll, in 2012 almost a third of Americans named Iran their country’s greatest enemy. That number matched public sentiment in the United States toward Saddam Hussein’s Iraq at the time of the 2003 invasion. The line graphs show the percentage of Americans who considered either Iraq or Iran their country’s greatest enemy from 2001 through 2012. Use this information to solve Exercises 49-50.
(In Exercises 49-50, refer to the graph at the bottom of the previous page.)
a. Find an estimate for the percentage of Americans who considered Iraq their country’s greatest enemy in 2001.
b. Between which two years did the percentage of Americans who considered Iraq their country’s greatest enemy decrease at the greatest rate?
c. In which year did 32% of Americans consider Iraq their country’s greatest enemy?
Want to see the full answer?
Check out a sample textbook solution
Chapter 1 Solutions
EBK THINKING MATHEMATICALLY


- A group of students plotted the number of hours they worked at a cake shop during the holidays and the number of cakes they delivered in a week.Which statement best describes the relationship between the number of hours spent working at the cake shop and the number of cakes delivered? Greater hours worked, more cakes delivered Fewer hours worked, more cakes delivered Greater hours worked, fewer cakes delivered There is no relationship between hours spent working and number of cakes delivered.arrow_forwardThe bar graph shows median yearly earnings of full-time workers in the United States for people 25 years and over with a college education, by final degree earned.The median yearly salary of an American whose final degreeis a doctorate is $45 thousand less than twice that of an American whose final degree is a bachelor’s. Combined,two people with each of these educational attainments earn $198 thousand. Find the median yearly salary of Americanswith each of these final degrees.arrow_forward2. As of 2019, Maryland ranked first among the 50 states in average (median) income, at about $86,700 per person, and Mississippi ranked last at $45,800 per person. In the example comparing the median income of people from Maryland and Mississippi, how much higher was the median income in Maryland than in Mississippi? In terms of absolute and relative difference.arrow_forward
- Show complete solution and clear hand writing. Show illustration and provide its given data.arrow_forwardReview the data in the Table 1, entitled, "Average Annual Salaries for Bachelor of Science Graduates, Summer 2016-Spring 2017". Using this data, create a chart (with a title, labeled axes, and a legend) comparing the average salaries that you could use to guide high school students who want salary influence the type of engineering major that they will choose. Consider, which fields tend to make the most money? Write a recommendation letter addressed to a high school student who wants to select an engineering field based on the salary; using a comparison of the data, recommend which majors they should most closely consider. Engineering - Average Annual Salaries & Hourly Wages for Undergraduates by Program, Summer 2016-Spring 2017 Average Annual Salaries for Bachelor of Science Graduates, Summer 2016-Spring 2017 | Offers/Acceptances with Salary Information 31 Average Annual Salaries $66,356 All Program Aeronautical & Astronautical Engineering Aviation Biomedical Engineering Chemical…arrow_forwardSo I'll include a line graph for a second visual aid. I have a chart to show the proportion of students by major that have student loan debt at our school.arrow_forward
- The stated intent of the 1994 “don’t ask, don’t tell” policy was toreduce the number of discharges of gay men and lesbians fromthe military. Nearly 14,000 active-duty gay servicemembers weredismissed under the policy, which officially ended in 2011, after18 years. The line given graph shows the number of discharges under “don’t ask, don’t tell” from 1994 through 2010. Use the data displayed by the graph to solve; Find the average rate of change, rounded to the nearest whole number, from 1994 through 1998. Describe what this means.arrow_forward12. The Coca-Cola Company had sales of $18, 546 million in 1996 and $21,900 million in 2004. Use the Midpoint Formula to estimate the sales in 1998, 2000, and 2002. Assume that the sales followed a linear pattern.arrow_forwardThe table below shows a recent graduate's credit card balance each month after graduation. Month 1 2 3 Debt ($) 620.00 761.88 899.80 a) Look at the graph on your calculator. Based on this graph, what type of equation should represent this situation? Explain your answer. b) Use your calculator to find the equation that you feel best fits this data. What is the equation? c) Based on this equation, what is the predicted amount of debt for month 9 after graduation?arrow_forward
- What does the graph reveal about the relationship between age groups and the use of smartphones for navigation?arrow_forwardBased on the line graph shown, how did Google's stock price perform between March 2015 and August 2015?arrow_forwardWhich graph has a line that represents the best fit for the recorded data?arrow_forward
 Algebra: Structure And Method, Book 1AlgebraISBN:9780395977224Author:Richard G. Brown, Mary P. Dolciani, Robert H. Sorgenfrey, William L. ColePublisher:McDougal Littell
 Holt Mcdougal Larson Pre-algebra: Student Edition...AlgebraISBN:9780547587776Author:HOLT MCDOUGALPublisher:HOLT MCDOUGAL
 Glencoe Algebra 1, Student Edition, 9780079039897...AlgebraISBN:9780079039897Author:CarterPublisher:McGraw Hill