Student Workbook For Elementary Statistics
13th Edition
ISBN: 9780134464237
Author: Laura Iossi
Publisher: PEARSON
expand_more
expand_more
format_list_bulleted
Videos
Textbook Question
Chapter 12, Problem 4CRE
In Exercises 1–5, refer to the following list of departure delay times (min) of American Airline flights from JFK airport in New York to LAX airport in Los Angeles. Assume that the data are samples randomly selected from larger populations.
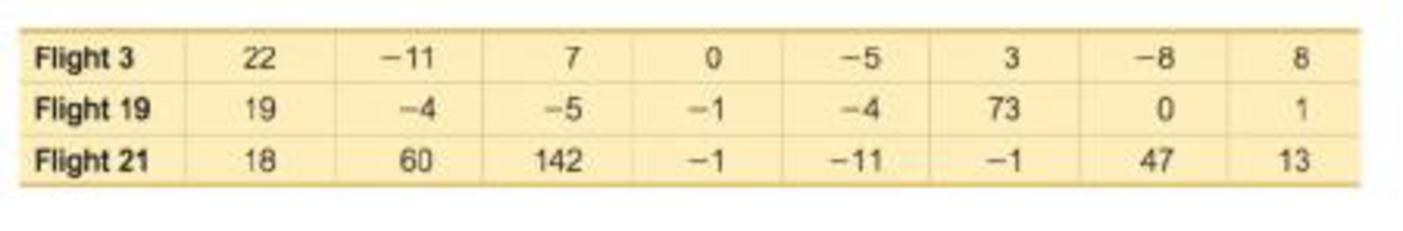
4. Confidence Interval Use the departure delay times for Flight 3 and construct a 95% confidence
Expert Solution & Answer
Want to see the full answer?
Check out a sample textbook solution
Students have asked these similar questions
In Exercises 1-5, refer to the following list of departure delay times (min) of American Airline flights from JFK airport in New York to LAX airport in Los Angeles. Assume that the data are samples randomly selected from larger populations.
Confidence Interval Use the departure delay times for Flight 3 and construct a 95% confidence interval estimate of the population mean. Write a brief statement that interprets the confidence interval.
In Exercises 1–5, use the following survey results: Randomly selected subjects were asked if they were aware that the Earth has lost half of its wildlife population during the past 50 years. Among 1121 women, 23% said that they were aware. Among 1084 men, 26% said that they were aware (based on data from a Harris poll).
Biodiversity When using the given sample data to construct a 95% confidence interval estimate of the difference between the two population proportions, the result of (−0.0659, 0.00591) is obtained from technology.
a. Express that confidence interval in a format that uses the symbol <.
b. What feature of the confidence interval is a basis for deciding whether there is a significant difference between the proportion of women aware of the statement and the proportion of men who are aware?
Listed below are the amounts of net worth (in millions of dollars) of the ten wealthiest celebrities in a country. Construct a
90%
confidence interval. What does the result tell us about the population of allcelebrities? Do the data appear to be from a normally distributed population as required?
253
207
180
167
164
157
147
147
147
147
What is the confidence interval estimate of the population mean μ?
What does the result tell us about the population of all celebrities? Select the correct choice below and, if necessary, fill in the answer box(es) to complete your choice.
Do the data appear to be from a normally distributed population as required?
Chapter 12 Solutions
Student Workbook For Elementary Statistics
Ch. 12.1 - In Exercises 1-4, use the following listed arrival...Ch. 12.1 - In Exercises 1-4, use the following listed arrival...Ch. 12.1 - In Exercises 1-4, use the following listed arrival...Ch. 12.1 - In Exercises 1-4, use the following listed arrival...Ch. 12.1 - In Exercises 5-16, use analysis of variance for...Ch. 12.1 - In Exercises 5-16, use analysis of variance for...Ch. 12.1 - In Exercises 5-16, use analysis of variance for...Ch. 12.1 - In Exercises 5-16, use analysis of variance for...Ch. 12.1 - In Exercises 5-16, use analysis of variance for...Ch. 12.1 - Prob. 10BSC
Ch. 12.1 - Triathlon Times Jeff Parent is a statistics...Ch. 12.1 - Arsenic in Rice Listed below are amounts of...Ch. 12.1 - Prob. 13BSCCh. 12.1 - Speed Dating Listed below are attribute ratings of...Ch. 12.1 - In Exercises 15 and 16, use the data set in...Ch. 12.1 - In Exercises 15 and 16, use the data set in...Ch. 12.1 - Tukey Test A display of the Bonferroni test...Ch. 12.2 - Two-Way ANOVA The pulse rates in Table 12-3 from...Ch. 12.2 - Two-Way ANOVA If we have a goal of using the data...Ch. 12.2 - Interaction a. What is an interaction between two...Ch. 12.2 - Balanced Design Does the table given in Exercise 1...Ch. 12.2 - Pulse Rates If we use the data given in Exercise 1...Ch. 12.2 - Weights The weights (kg) in the following table...Ch. 12.2 - Heights The heights (cm) in the following table...Ch. 12.2 - Pancake Experiment Listed below are ratings of...Ch. 12.2 - Marathon Times Listed below are New York City...Ch. 12.2 - Smoking, Gender, and Body Temperature The table...Ch. 12.2 - Transformations of Data Example 1 illustrated the...Ch. 12 - Cola Weights Data Set 26 Cola Weights and Volumes...Ch. 12 - Cola Weights For the four samples described in...Ch. 12 - Cola Weights For the analysis of variance test...Ch. 12 - Cola Weights Identify the value of the test...Ch. 12 - Cola Weights The displayed results from Exercise 1...Ch. 12 - One-Way ANOVA In general, what is one-way analysis...Ch. 12 - One vs. Two What is the fundamental difference...Ch. 12 - Estimating Length Given below is a Minitab display...Ch. 12 - Estimating Length Using the same results displayed...Ch. 12 - Estimating Length Using the same results displayed...Ch. 12 - Speed Dating Data Set 18 Speed Dating in Appendix...Ch. 12 - Author Readability Pages were randomly selected by...Ch. 12 - Prob. 3RECh. 12 - Speed Dating Listed below are attribute ratings of...Ch. 12 - In Exercises 1-5, refer to the following list of...Ch. 12 - In Exercises 1-5, refer to the following list of...Ch. 12 - In Exercises 1-5, refer to the following list of...Ch. 12 - In Exercises 15, refer to the following list of...Ch. 12 - In Exercises 15, refer to the following list of...Ch. 12 - Quarters Assume that weights of quarters minted...Ch. 12 - Job Priority Survey USA Today reported on an...Ch. 12 - Win 4 Lottery Shown below is a histogram of digits...Ch. 12 - Does Weight Change with Age? Refer to Data Set 1...
Knowledge Booster


Learn more about
Need a deep-dive on the concept behind this application? Look no further. Learn more about this topic, statistics and related others by exploring similar questions and additional content below.Similar questions
- In Exercises 5–8, use the relatively small number of given bootstrap samples to construct the confidence interval. Online Buying In a Consumer Reports Research Center survey, women were asked if they purchase books online, and responses included these: no, yes, no, no. Letting “yes” = 1 and letting “no” = 0, here are ten bootstrap samples for those responses: {0, 0, 0, 0}, {1, 0, 1, 0 }, {1, 0, 1, 0}, {0, 0, 0, 0}, {0, 0, 0, 0}, {0, 1, 0, 0}, {0, 0, 0, 0}, {0, 0, 0, 0}, {0, 1, 0, 0}, {1, 1, 0, 0}. Using only the ten given bootstrap samples, construct a 90% confidence interval estimate of the proportion of women who said that they purchase books online.arrow_forwardIn Exercises 5–16, use the listed paired sample data, and assume that the samples are simple random samples and that the differences have a distribution that is approximately normal. Body Temperatures Listed below are body temperatures from seven different subjects measured at two different times in a day (from Data Set 3 “Body Temperatures” in Appendix B). a. Use a 0.05 significance level to test the claim that there is no difference between body temperatures measured at 8 AM and at 12 AM. b. Construct the confidence interval that could be used for the hypothesis test described in part (a). What feature of the confidence interval leads to the same conclusion reached in part (a)?arrow_forwardIn a situation where the sample size was decreased from 39 to 29 in a normally distributed data set, what would be the impact on the confidence interval?arrow_forward
- 2). Using the RestaurantTips data set which compares servers, tips, and credit card usage, we have the following two-way table. It shows the servers and whether or not the customer used a credit card to pay for their meal. (Hint: You'll have to total each column and row to calculate the proportions below) A B C Yes 21 15 15 No 39 50 17 a) Compute and interpret a 95% confidence interval for the proportion of bills paid with a credit card. (Statkey: Confidence Interval for Proportion) b) Compute and interpret 90% confidence intervals for the proportion of bills for each server. (Statkey: Confidence Interval for Proportion) c) From the confidence intervals in part b) does it appear that Server B is responsible for 1/3 of the bills this week?arrow_forwarda) Compare the “prop. contained” value from the chart to the confidence level associated with the simulation in sentence b) Write an interpretation for your confidence interval methods in terms of what would happen if more samples of the same sample size were taken and their respective confidence intervals calculated.arrow_forwardIn a survey of 500 students, 180 students said that they prefer classes on Mondays and Wednesdays rather than on Tuesdays and Thursdays. Using a 95% confidence interval, answer the following questions. a. What is the margin of error for this study? b. Construct a 95% confidence interval that estimates the proportion of students that prefer classes on Mondays and Wednesdays.arrow_forward
- A risk manager is analyzing a 1-day 98% VaR model. Assuming 252 days in a year, what is the maximum number of daily losses exceeding the 1-day 98% VaR that is acceptable in a 1-year backtest to conclude, at a 95% confidence level, that the model is calibrated correctly? a)5 b)9 c)10 d)12arrow_forwarda. What is the best estimate for the standard error of the sampling distribution? b. What is the value of Z for this confidence interval? c. What is the margin of error for this confidence interval? d. What is the lower bound of the confidence interval?arrow_forwarda. Given that Emily used a coin toss to select either her right hand or her left hand, what proportion of correct responses would be expected if the touch therapists made random guesses? b. Using Emily's sample results, what is the best point estimate of the therapists' success rate? c. Using Emily's sample results, construct a 95% confidence interval estimate of the proportion of correct responses made by touch therapists.arrow_forward
- Determine the sample size n needed to construct a 90% confidence interval to estimate the population mean for the following margins of error when σ=72. a) 5 b) 8 c) 10arrow_forwardIn Exercises 5–16, use the listed paired sample data, and assume that the samples are simple random samples and that the differences have a distribution that is approximately normal. Self-Reported and Measured Male Heights As part of the National Health and Nutrition Examination Survey, the Department of Health and Human Services obtained self-reported heights (in.) and measured heights (in.) for males aged 12–16. Listed below are sample results. Construct a 99% confidence interval estimate of the mean difference between reported heights and measured heights. Interpret the resulting confidence interval, and comment on the implications of whether the confidence interval limits contain 0.arrow_forwardPART 1 (CLO 1) Construct a confidence interval to estimate the mean height and the mean weight by completing the following: PERSON WEIGHT HEIGHT (INCHES) Person 1 160 62 Person 2 180 67 Person 3 187 68 Person 4 202 71 Person 5 142 65 Person 6 201 65 Person 7 150 66 Person 8 133 62 Person 9 120 64 Find the sample mean and the sample standard deviation of the height. Find the sample mean and the sample standard deviation of the weight. Construct and interpret a confidence interval to estimate the mean height. Construct and interpret a confidence interval to estimate the mean weight.arrow_forward
arrow_back_ios
SEE MORE QUESTIONS
arrow_forward_ios
Recommended textbooks for you
 MATLAB: An Introduction with ApplicationsStatisticsISBN:9781119256830Author:Amos GilatPublisher:John Wiley & Sons Inc
 Probability and Statistics for Engineering and th...StatisticsISBN:9781305251809Author:Jay L. DevorePublisher:Cengage Learning
 Statistics for The Behavioral Sciences (MindTap C...StatisticsISBN:9781305504912Author:Frederick J Gravetter, Larry B. WallnauPublisher:Cengage Learning
 Elementary Statistics: Picturing the World (7th E...StatisticsISBN:9780134683416Author:Ron Larson, Betsy FarberPublisher:PEARSON
 The Basic Practice of StatisticsStatisticsISBN:9781319042578Author:David S. Moore, William I. Notz, Michael A. FlignerPublisher:W. H. Freeman
 Introduction to the Practice of StatisticsStatisticsISBN:9781319013387Author:David S. Moore, George P. McCabe, Bruce A. CraigPublisher:W. H. Freeman
MATLAB: An Introduction with Applications
Statistics
ISBN:9781119256830
Author:Amos Gilat
Publisher:John Wiley & Sons Inc
Probability and Statistics for Engineering and th...
Statistics
ISBN:9781305251809
Author:Jay L. Devore
Publisher:Cengage Learning
Statistics for The Behavioral Sciences (MindTap C...
Statistics
ISBN:9781305504912
Author:Frederick J Gravetter, Larry B. Wallnau
Publisher:Cengage Learning
Elementary Statistics: Picturing the World (7th E...
Statistics
ISBN:9780134683416
Author:Ron Larson, Betsy Farber
Publisher:PEARSON
The Basic Practice of Statistics
Statistics
ISBN:9781319042578
Author:David S. Moore, William I. Notz, Michael A. Fligner
Publisher:W. H. Freeman
Introduction to the Practice of Statistics
Statistics
ISBN:9781319013387
Author:David S. Moore, George P. McCabe, Bruce A. Craig
Publisher:W. H. Freeman
Hypothesis Testing using Confidence Interval Approach; Author: BUM2413 Applied Statistics UMP;https://www.youtube.com/watch?v=Hq1l3e9pLyY;License: Standard YouTube License, CC-BY
Hypothesis Testing - Difference of Two Means - Student's -Distribution & Normal Distribution; Author: The Organic Chemistry Tutor;https://www.youtube.com/watch?v=UcZwyzwWU7o;License: Standard Youtube License