
Videos
(a)
To graph: The plot
(a)
Explanation of Solution
Given: The value of
Graph: The plot is drawn by following these steps:
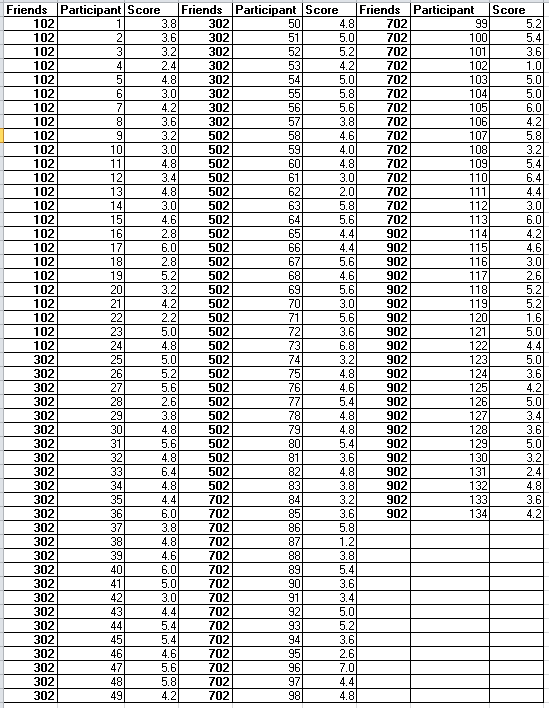
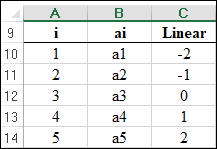
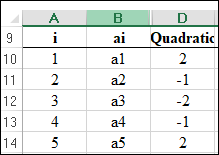
Step 1: Open Excel sheet and write the data value for
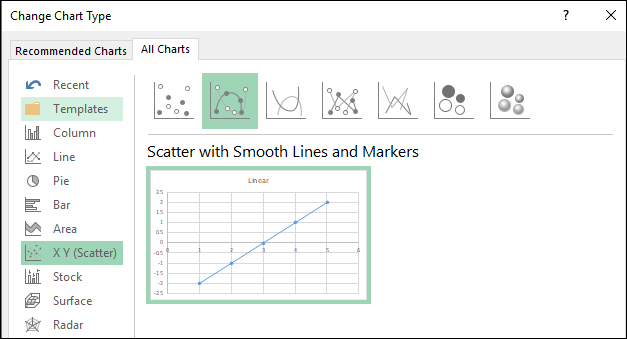
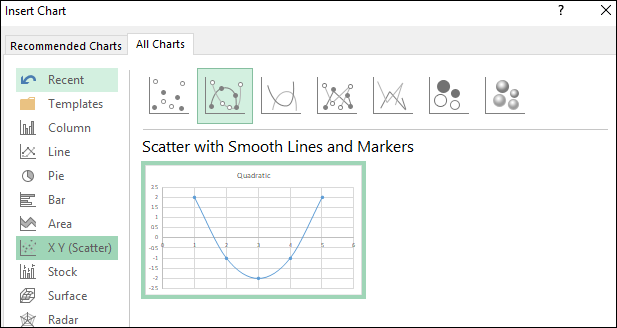
Step 2: INSERT > Recommended Charts > All Charts > Line Chart. The screenshot is shown below:
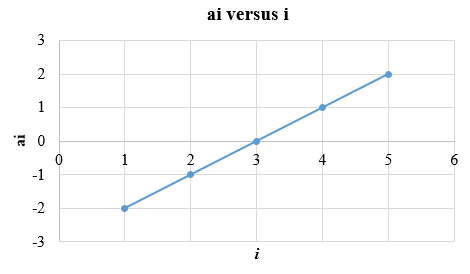
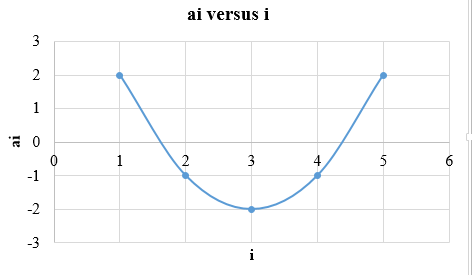
The plot is obtained as shown below:
The values chosen for
The contrast can be calculated by the sum of weighted means. If
Interpretation: The value of
(b)
To graph: The plot
(b)
Explanation of Solution
Graph: The plot is drawn by following these steps:
Step 1: Open Excel sheet and write the data value for
Step 2: INSERT > Recommended Charts > All Charts > Line Chart. The screenshot is shown below:
The plot is obtained as shown below:
The contrast can be calculated by the sum of weighted means. If
The contrast for means
Interpretation: The value chosen,
(c)
To find: The sample contrast quadratic and cubic trend.
(c)
Answer to Problem 50E
Solution: Contrasts for the quadratic trend can be calculated as:
Contrasts for the cubic trend can be calculated as:
Explanation of Solution
Calculation: To find sample contrasts for quadratic and cubic trend by using the Facebook data as follows:
Contrasts for the quadratic trend can be calculated as:
Contrasts for the cubic trend can be calculated as:
(d)
To test: The hypotheses for the linear, quadratic, and cubic trend.
(d)
Answer to Problem 50E
Solution: The P-values are less than 0
Explanation of Solution
Calculation: To test the null hypothesis, steps are as follows:
Contrasts for the linear trend can be calculated as:
Contrasts for the quadratic trend can be calculated as:
Contrasts for the cubic trend can be calculated as:
The pooled standard deviation is obtained as:
The standard error of linear contrast can be calculated as:
The standard error of quadratic contrast can be calculated as:
The standard error of cubic contrast can be calculated as:
The resultant t statistic values for the linear trend can be calculated as:
The resultant t-statistic values for the quadratic trend can be calculated as:
The resultant t-statistic values for the cubic trend can be calculated as:
The resultant P-values are obtained by using the standard normal distribution table as follows:
Conclusion: The P-values is less than 0
Want to see more full solutions like this?
Chapter 12 Solutions
INTRO.TO PRACTICE STATISTICS-ACCESS


- Too Many Corn Plants per Acre? The more corn a farmer plants per acre, the greater is the yield the farmer can expect. But only up to a point, many plants acre can cause Overcrowding and decrease yields, data give yields per acre for various densities of corn plantings, as found by researchers at a university test farm. (a) Find the quadratic polynormal that best fits the data. (b) Draw a graph of the polynomial from part (a) together with a scatter plot of the data. (c) use your result (b) to estimate the yield for 37000 plants per acre.arrow_forwardFind a polynomial of degree 2 to fit the following data: refer to imagearrow_forwardThe U.S. census lists the population of the United States as 227 million in 1980, 249 million in 1990, and 281 million in 2000. Fit a second-degree polynomial passing through these three points and use it to predict the population in 2014 and in 2022.† (Round your answers to the nearest million.) STEP 1: Let x represent the year. Write a polynomial in t where t = x – 1990.p(t) = STEP 2: Substitute the appropriate values of t for the predictions. (Round your answers to the nearest integer.) 2014 prediction million 2022 prediction millionarrow_forward
- The bar graph shows the differences among age groups on the Implicit Association Test that measures levels of racial prejudice. Higher scores indicate stronger bias. Solve, a. The data can be described by the following polynomial model of degree 3: S = 0.2x3 - 1.5x2 + 3.4x + 25 + (0.1x3 - 1.3x2 + 3.3x + 5). In this polynomial model, S represents the score on the Implicit Association Test for age group x. Simplify the model. b. Use the simplified form of the model from part (a) to find the score on the Implicit Association Test for the group in the 45–54 age range. How well does the model describe the score displayed by the bar graph?arrow_forwardFind y(4.5) if a second-degree polynomial is fitted to the following data: (1, 1.1), (1.5, 1.3), (2, 1.6), (2.5, 2), (3, 2.7), (3.5, 3.4), (4, 4.1). Round-off to four decimals.arrow_forwardDescribe the polynomial interpolation problem.What is the degree of precision of a quadrature formula?Describe Richardson extrapolation (for numerical intergration).arrow_forward
- The following data represents the relationship between the drying time of a certain varnish and the amount of additive that is intended to reduce the drying time. (g) Additive(h) drying time A) Draw a scatter plot to verify that it is reasonable to assume that the relationship is parabolic. B) Fit a polynomial of the second degree with the method of least squares. C) Predict the drying time of the varnish when using 6.5 g of additive.arrow_forwardFind y(4.5) if a second-degree polynomial is fitted to the following data: (0, 3), (1, 6), (2, 8), (3, 11), (4, 13), (5, 14)arrow_forwardA town’s jobless rate can be modeled by (1, 3.3), (2, 4.9), (3, 5.3), (4, 6.4), (5, 4.5), (6, 5.6), (7, 2.5), and (8, 2.7). How many turning points would the graph of a polynomial function through these points have? Identify the number of relative maximum and relative minimum values.arrow_forward
- Suppose experimental data are represented by a set of points in the plane. An interpolating polynomial for the data is a polynomial whose graph passes through every point. In scientific work, such a polynomial can be used, for example, to estimate values between the known data points. Another use is to create curves for graphical images on a computer screen. One method for finding an interpolating polynomial is to solve a system of linear equations. Find the interpolating polynomial of (SEE PICTURE)arrow_forwardHow do you go about figuring out the upper and lower bounds for a polynomial? Is it just random guessing? And once you find the numbers, is there a certain order you have to write them in?arrow_forwardAdvanced Math Find a polynomial generating function for the number of partitions of the number 12 into distinct parts where no number is used more than twice. For example 12 = 3+3+6 would be a valid partition but 12 = 2+2+2+6 would not be a valid split. State the total number of such partitions below. Please give a numerical Answer! Its not 11 nor 23arrow_forward
 College AlgebraAlgebraISBN:9781305115545Author:James Stewart, Lothar Redlin, Saleem WatsonPublisher:Cengage Learning
 Algebra & Trigonometry with Analytic GeometryAlgebraISBN:9781133382119Author:SwokowskiPublisher:Cengage
 Intermediate AlgebraAlgebraISBN:9781285195728Author:Jerome E. Kaufmann, Karen L. SchwittersPublisher:Cengage Learning
 Algebra for College StudentsAlgebraISBN:9781285195780Author:Jerome E. Kaufmann, Karen L. SchwittersPublisher:Cengage Learning