Videos
There is a strong scientific consensus that human activities arc changing the Earth's climate. Scientists now believe that there is a strikingcorrelation between atmospheric carbon dioxide concentration and global temperature As both of these variables increase at significantrates, there are warnings of a planetary emergency that threatens to condemn corning generations to a catastrophically diminished future. The bar graphs give the average atmospheric concentration of carbon dioxide and the average global temperature for eight selected years. Use this information to solve Exercises 51-52.
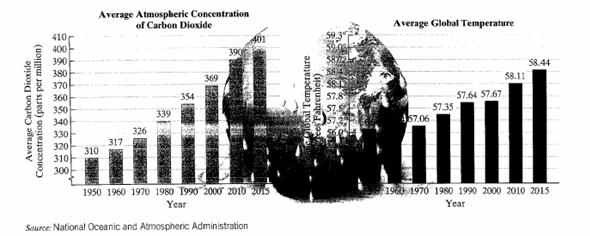
Source National Oceanic and Atmospheric Administration
51. a. Estimate the yearly increase in the average atmosphericconcentration of carbon dioxide. Express the answer inparts per million. 1.4 ppm per yr
b. Write a mathematical model that estimates the averageatmospheric concentration of carbon dioxide. C. in partsper million, x years after 1950.
c. If the trend shown by the data continues, use yourmathematical model from part (b) to project theaverage atmospheric concentration of carbon dioxide in2050. 450 ppm
Want to see the full answer?
Check out a sample textbook solution
Chapter 1 Solutions
Thinking Mathematically Plus MyLab Math -- Access Card Package (7th Edition) (What's New in Service Math)


- Does a linear, exponential, or logarithmic model best fit the data in Table 2? Find the model.arrow_forwardChapter 7, Section 7.3, Question 042 Find how much time it takes until a rain forest whose area is reduced by 50% every 14 years reaches one-sixteenth of its starting area. The rain forest reaches one-sixteenth of its starting area in years Open Show Work Click if you would like to Show Work for this question:arrow_forwardCan someone please help? Thank you.arrow_forward
- When a drug is administered orally it takes some time before the blood concentration reaches its maximum level. After that time, concentration levels decrease. When 500 milligrams of procainamide is administered orally, one model for a particular patient gives blood concentration C, in milligrams per liter, after t hours as C = 2.65(e-09-e-⁹). What is the maximum blood-level concentration, and when does that level occur? (Round your answers to two decimal places.) maximum 1.49 concentration x mg/L 0.12 xhr timearrow_forwardarget's annual revenue data from 2005 to 2021 are available for download. Make an Excel graph of the annual data, and fit three trends (linear, quadratic, and exponential) to the time series. Copy and paste the graph in the space below or attach the file. State the three trendline equations from part a and their R2 values. Which trend model do you think is the best one to use to forecast annual revenue? Choose only one model and explain the reasons for your choice. Use the model you chose in part c to forecast the annual revenue for 2022. Annual Operating Income Year t (Millions of US $) 2005 1 46839 2006 2 52620 2007 3 59490 2008 4 63367 2009 5 64948 2010 6 65357 2011 7 67390 2012 8 69865 2013 9 73301 2014 10 71279 2015 11 72618 2016 12 73785 2017 13 70271 2018 14 72714 2019 15 75356 2020 16 78112 2021 17 93561arrow_forwardA webassign.net 88 83 Homework - MATH 1401, section 1E0 - Knofczynski, Spring 2022 | WebAss. O TurboTax Login - Sign in to TurboTax to work on Your Tax Return Lesson 8.3 Homework - Elementary Statistics Section 1EG Spring 2022 Cco Is the national crime rate really going down? Some sociologists say yes! They say that the reason for the decline in crime rates in the 1980s and 1990s is demographics. It seems that the population is aging, and older people commit fewer crimes. According to the FBI and the Justice Department, 70% of all arrests are of males aged 15 to 34 yearst. Suppose you are a sociologist in Rock Springs, Wyoming, and a random sample of police files showed that of 37 arrests last month, 29 were of males aged 15 to 34 years. Use a 5% level of significance to test the claim that the population proportion of such arrests in Rock Springs is different from 70%. A USE SALT (a) What is the level of significance? State the null and alternate hypotheses. Ho: P- 0.7; H:p > 0.7 Hoi…arrow_forward
- The Consumer Price Index (CPI) is a measure of the average change in price over time from a designated reference period, at which it equals 100. The index is based on prices of basic consumer goods and services. The table provided lists the CPI for several years from 1960 to 2012. If the price change in cars parallels the change in the CPI, what would a car sell for (to the nearest dollar) in 2012 if a comparable model sold for $12,000 in 1999? Year CPI 1960 29.6 1973 44.4 109.6 156.9 1986 1999 2012 229.6 In 2012, a car would sell for approximately S (Round to the nearest dollar.)arrow_forwardPlease solve part a only in 20 minutesarrow_forwardDoes almost everyone become unemployed at some point in their life? Support answer with peer reviewed article.arrow_forward
- Part 1: Application Suppose you drive 60 miles in 45 minutes. However, you forgot that you left your smartphone on and because of that, your data was tracked by the police, and they issue you a speeding ticket based on the data. How did they know that you had to be speeding at some point? (Assume the general maximum speed limit is 70 miles/hour.) (Remember to convert minutes to hours)arrow_forwardExplain what a time value analysis chart is used for and list the three components within it.arrow_forwardTuberculosis (TB) is one of the top 10 causes of death worldwide. According to the World Health Organization (WHO), deaths from TB have fallen by an average of 1.2% per year between 2000 and 2015. In the year 2000, there were approximately 2.5 million deaths from TB. Part 1. Use the given data to create an exponential decay function to model the number of deaths from TB in terms of years, tt, where t=0 represents the year 2000. Part 2. Use this function to determine the year in which the number of deaths from TB was 2.1 million.arrow_forward
 Mathematics For Machine TechnologyAdvanced MathISBN:9781337798310Author:Peterson, John.Publisher:Cengage Learning,
 Glencoe Algebra 1, Student Edition, 9780079039897...AlgebraISBN:9780079039897Author:CarterPublisher:McGraw Hill
 Algebra & Trigonometry with Analytic GeometryAlgebraISBN:9781133382119Author:SwokowskiPublisher:Cengage
 Algebra for College StudentsAlgebraISBN:9781285195780Author:Jerome E. Kaufmann, Karen L. SchwittersPublisher:Cengage Learning
 Algebra: Structure And Method, Book 1AlgebraISBN:9780395977224Author:Richard G. Brown, Mary P. Dolciani, Robert H. Sorgenfrey, William L. ColePublisher:McDougal Littell