
Videos
Debt Management and Short-Term
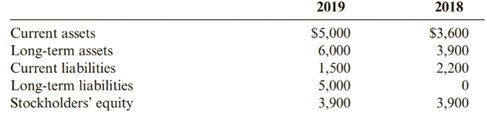
Magellan Company is an international travel agency providing travel planning services to customers in over 20 Countries. Recently, the travel industry has been experiencing volatility as a result of increases in oil prices. Magellan’s investors have been following its financial information closely to determine its ability to continue as a going concern, Its investors have used the following information to determine financial ratios:
Required:
Between 20l8 and 20l9, indicate whether Magellan’s debt to equity ratio increased or decreased. Also, indicate whether Magellan’s

Trending nowThis is a popular solution!

Chapter 12 Solutions
Cengagenowv2, 1 Term Printed Access Card For Rich/jones' Cornerstones Of Financial Accounting, 4th


- Long-term solvency refers to a company’s ability to pay its long-term obligations. Financing ratios provideinvestors and creditors with an indication of this element of risk.Required:1. Calculate the debt to equity ratio for AGF for 2018. The average ratio for the stocks listed on the New YorkStock Exchange in a comparable time period was 1.0. What information does your calculation provide aninvestor?2. Is AGF experiencing favorable or unfavorable financial leverage?3. Calculate AGF’s times interest earned ratio for 2018. The coverage for the stocks listed on the New YorkStock Exchange in a comparable time period was 5.1. What does your calculation indicate about AGF’s risk?arrow_forwardCertain financial ratios for The Gap for its most recent year are given below, along with the average ratios for its industry. Based on those ratios, answer the following. 1) Does The Gap seem to prefer to finance its assets with debt or with equity? How can you tell? What percent of its assets are funded with debt? What percent of its assets are funded with equity? 2) A supplier to The Gap sells merchandise to The Gap and asks to be paid within 60 days. While any of The Gap’s financial ratios might be of interest to the supplier, which of the ratios listed below do you think would likely be the most important one to the supplier? Why? 3) Which of the ratios presented suggest that, compared to its industry, The Gap may have a problem controlling its operating expenses? How can you tell? Your answer should clearly indicate that you understand why the ratio that you chose answers this question. Here is the data for The Gap and its industry. Financial Ratios…arrow_forwardbased on the ratio analysis below will the company be successful after taking a 500.0 mil loan to regain the lead in the construction market and to expand its business to the sale of heavy equipment? or should the company sought other forms of financing? Analysis of Financial Data (Table with ratios) Ratio Analysis 2021 Est. 2020 2019 Industry Average Liquidity Ratios Current Ratio (times) 2.34 3.22 3.68 4.2 Quick Ratio (times) 0.91 1.24 1.79 2.1 Asset Management Ratios Average sales/day 10.96 8.22 7.81 9 Inventory Turnover Ratio (times) 6.08 5.83 5.06 9 Days Sales Outstanding (days) 38.32 45.62 40.34 36 Fixed Assets Turnover Ratio (times) 2.12 2.52 3.27 3 Total Asset Turnover Ratio 1.32 1.37 1.69 1.8 Debt Management Ratios Total Debt to Total Assets (%) 59.09…arrow_forward
- Compute Liquidity and Solvency Ratios for Competing Firms Halliburton and Schlumberger compete in the oil field services sector. Refer to the following 2018 financial data for the two companies to answer the requirements. $ millions Cash and equivalents Short-term investments Accounts receivable Current assets Current liabilities Total liabilities Total equity Earnings before interest and tax (EBIT) Interest expense, gross HAL SLB $2,008 $1,433 1,344 5,391 8,117 11,151 15,731 4,946 13.891 16,438 33,921 1. Current ratio 2. Quick ratio 3. Times interest earned 4. Liabilities-to-equity 9,830 37,684 2,541 3,142 554 537 a. Compute the following measures for both companies. Note: Round your final answers to two decimal places (for example, enter 6.78 for 6.77555). HAL SLB b. Which company appears more liquid? c. Which company appears more solvent? ◆arrow_forwardRATIO ANALYSIS The Corrigan Corporation’s 2017 and 2018 financial statements follow,along with some industry average ratios.a. Assess Corrigan’s liquidity position, and determine how it compares with peers andhow the liquidity position has changed over time.b. Assess Corrigan’s asset management position, and determine how it compares withpeers and how its asset management efficiency has changed over time.c. Assess Corrigan’s debt management position, and determine how it compares withpeers and how its debt management has changed over time.d. Assess Corrigan’s profitability ratios, and determine how they compare with peersand how its profitability position has changed over time.e. Assess Corrigan’s market value ratios, and determine how its valuation compares withpeers and how it has changed over time. Assume the firm’s debt is priced at par, sothe market value of its debt equals its book value. f. Calculate Corrigan’s ROE as well as the industry average ROE, using the DuPontequation.…arrow_forwardYou want to compare Rite Aid's leverage to other firms in the Retail Pharmaceutical industry. To assist you, the table below reports the industry averages for several common debt ratios. Calculate each of the ratios in the table for Rite Aid for the years ending February 28, 2004 and March 1, 2003. Ratio Definition Industry Average Rite Aid FY2004 Rite Aid FY2003 Common-size debt Total liabilities / Total assets 51.91% 99.85% 101.51% Common-size interest expense Interest expense / Net sales 0.65% 1.89% 2.09% Debt to equity Total liabilities / Total shareholders' equity 1.59 6732.96 -55.43 Long-term debt to equity Long-term debt / Total shareholder's equity 0.58 420.08 -34.39 Proportion of long-term debt due in one year Long-term debt due in one year / Total long-term debt 13.00% 0.616% 2.69% Times-interest-earned (interest coverage) (Pre-tax income + interest expense) / Interest expense 9.98x 1.11 0.53 How does Rite Aid compare to the…arrow_forward
- If given the opportunity, in which of the firms would you invest based on the result of your analysis of both companies and the comparison with the industry? If you would not invest, explain your reasons according to the results obtained. Company Name: Year 2018 Chemicals and Allied Products Industry Ratios ………….. Solvency or Debt Ratios Merck J&J 2018 Debt ratio 0.67 0.61 0.47 Debt-to-equity ratio 0.93 0.51 0.38 Interest coverage ratio 12.27 18.91 -9.43 Liquidity Ratios Current ratio 1.17 1.47 3.47 Quick ratio 0.92 1.16 2.12 Cash ratio 0.40 0.63 2.24 Profitability Ratios Profit margin 14.64% 18.75% -93.4% ROE (Return on equity), after tax 23.03% 25.60% -248.5 ROA (Return on assets) 7.49% 10.00% -146.5 Gross margin 68.06% 66.79% 55.3% Operating margin (Return on sales) 19.62% 24.27%…arrow_forwardSelected financial data for Bahama Bay and Caribbean Key are as follows:Required:1. Calculate the debt to equity ratio for Bahama Bay and Caribbean Key for the most recent year. Which company has the higher ratio?2. Calculate the return on assets for Bahama Bay and Caribbean Key. Which company appears more profitable?3. Calculate the times interest earned ratio for Bahama Bay and Caribbean Key. Which company is better able to meet interest payments as they become due?arrow_forwardRATIO ANALYSIS The Corrigan Corporation's 2017 and 2018 financialstatements follow, along with some industry average ratios.a. Assess Corrigan's liquidity position, and determine how itcompares with peers and how the liquidity position has changedover time.b. Assess Corrigan's asset management position, and determinehow it compares with peers and how its asset managementefficiency has changed over time.c. Assess Corrigan's debt management position, and determinehow it compares with peers and how its debt management haschanged over time.d. Assess Corrigan's profitability ratios, and determine how theycompare with peers and how its profitability position has changedover time.e. Assess Corrigan's market value ration, and determine how itsvaluation compares with peers and how it has changed over time.Assume the firm's debt is priced at par, so the market value of itsdebt equals its book value. f. Calculate Corrigan's ROE as well as the industry average ROE,using this DuPont equation. From…arrow_forward
- 1) If debts to equity ratio equal to 100% so, debts to assets ratio equal? A)50% B) 150% C) 75% 2) increasing in global. oil pricing for Jordanian industrial corporations is considered: A) opportunity B) threats C) weakness D) strength 3) the correct arrangement for the following analysis is A) financial analysis, accounting analysis, prospective analysis B) financial analysis, prospective analysis, accounting analysis C) accounting analysis, financial analysis, prospective analysis D) prospective analysis, accounting analysis, financial analysis.arrow_forwardbased on the financial ratio anaylsis of the company below, will the comapny be successful after taking a 500.0 mil dollar loan? or should they sought other forms of financing? Analysis of Financial Data (Table with ratios) Ratio Analysis 2021 Est. 2020 2019 Industry Average Liquidity Ratios Current Ratio (times) 2.34 3.22 3.68 4.2 Quick Ratio (times) 0.91 1.24 1.79 2.1 Asset Management Ratios Average sales/day 10.96 8.22 7.81 9 Inventory Turnover Ratio (times) 4.43 3.74 5.06 9 Days Sales Outstanding (days) 38.32 45.62 40.34 36 Fixed Assets Turnover Ratio (times) 2.12 2.52 3.27 3 Total Asset Turnover Ratio 1.32 1.37 1.69 1.8 Debt Management Ratios Total Debt to Total Assets (%) 59.09 48.58 47.6 40 Times Interest Earned (times) 7.9 6.81 11 6…arrow_forwardCompute Liquidity and Solvency Ratios for Competing Firms Halliburton and Schlumberger compete in the oil field services sector. Refer to the following 2018 financial data for the two companies to answer the requirements. $ millions Cash and equivalents Short-term investments Accounts receivable Current assets Current liabilities Total liabilities Total equity Earnings before interest and tax (EBIT) Interest expense, gross a. Compute the following measures for both companies. Note: Round your final answers to two decimal places (for example, enter 6.78 for 6.77555). 1. Current ratio 2. Quick ratio 3. Times interest earned 4. Liabilities-to-equity HAL SLB $2,008 $1,433 1,344 5,077 7,645 11,151 15,731 4,658 13,081 16,438 33,921 9,258 35,488 2,393 2,959 554 537 HAL 2.28 x 1.5 x 4.54 x 1.69 * SLB 1.114 x 0.79 x 5.79 * 0.91 x b. Which company appears more liquid? HAL c. Which company appears more solvent? SLB =arrow_forward
 Cornerstones of Financial AccountingAccountingISBN:9781337690881Author:Jay Rich, Jeff JonesPublisher:Cengage Learning
 EBK CONTEMPORARY FINANCIAL MANAGEMENTFinanceISBN:9781337514835Author:MOYERPublisher:CENGAGE LEARNING - CONSIGNMENT
 Financial Reporting, Financial Statement Analysis...FinanceISBN:9781285190907Author:James M. Wahlen, Stephen P. Baginski, Mark BradshawPublisher:Cengage Learning