
Cengagenowv2, 1 Term Printed Access Card For Rich/jones' Cornerstones Of Financial Accounting, 4th
4th Edition
ISBN: 9781337690911
Author: Jay Rich, Jeff Jones
Publisher: Cengage Learning
expand_more
expand_more
format_list_bulleted
Videos
Textbook Question
Chapter 12, Problem 80E
Asset Efficiency Ratios
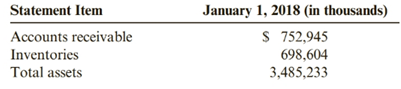
Refer to financial statements in Exercise 12-76 and the information below.
Required:
1. Compute the three asset efficiency ratios (rounded to two decimal places) for 2018 and 2019.
2. Indicate the length of Steele’s operating cycle in days (rounded to two decimal places) for the years ended December 31, 2019. and December 31, 2018.
Expert Solution & Answer
Want to see the full answer?
Check out a sample textbook solution
Students have asked these similar questions
Cullumber Limited competes in the fast food industry with Bramble Limited. Cullumber underwent a major expansion in 2021,
borrowing a large amount of money and acquiring a small competitor. The acquisition doubled the number of restaurants that
Cullumber has. Bramble, on the other hand, took a more conservative approach and did not buy any new assets, focusing instead on
making existing operations more efficient.
Data for the two companies are provided below (in thousands of dollars):
Cullumber
Total assets
Sales
Net income
Bramble
Total assets
Sales
Net income
2021
$1,850
3,161
361
807
1,822
190
2020
$1,099 $1,070
1,490
144
880
1,671
2019
205
1,600
140
1,070
2,000
210
The following selected information is for H55 Corporation:
Total assets
Total shareholders' equity
Sales
Cost of goods sold
Net income.
H55 had no preferred shares.
ype here to search
2021
$357,000 $285,000
136.000
503.000
378.759
2020
32.695
97,500
394,000
276.982
29.944
2019
$267,000
48,500
297.000
181,000
20,400
Here is the operating data for Yalis Cleaning, Inc.:
After analyzing the transactions, prepare a vertical analysis schedule for the company for 2021 and 2020 using service revenue as the base amount. Round percentages to two decimal places.
Chapter 12 Solutions
Cengagenowv2, 1 Term Printed Access Card For Rich/jones' Cornerstones Of Financial Accounting, 4th
Ch. 12 - Describe how some of the primary groups of users...Ch. 12 - Prob. 2DQCh. 12 - Prob. 3DQCh. 12 - Prob. 4DQCh. 12 - Prob. 5DQCh. 12 - Prob. 6DQCh. 12 - Prob. 7DQCh. 12 - Prob. 8DQCh. 12 - Prob. 9DQCh. 12 - Prob. 10DQ
Ch. 12 - Prob. 11DQCh. 12 - 12. Why are higher asset turnover ratios...Ch. 12 - Prob. 13DQCh. 12 - Prob. 14DQCh. 12 - Prob. 15DQCh. 12 - Prob. 16DQCh. 12 - Which of the following use financial statement...Ch. 12 - Prob. 2MCQCh. 12 - Prob. 3MCQCh. 12 - Prob. 4MCQCh. 12 - Prob. 5MCQCh. 12 - Prob. 6MCQCh. 12 - Prob. 7MCQCh. 12 - Which type of analysis compares a single...Ch. 12 - Which of the following types of analysis compares...Ch. 12 - Which of the following types of analysis is...Ch. 12 - Prob. 11MCQCh. 12 - Prob. 12MCQCh. 12 - Prob. 13MCQCh. 12 - Partial information from Fabray Companys balance...Ch. 12 - Hummel Inc. has $30,000 in current assets and...Ch. 12 - Prob. 16MCQCh. 12 - A firms quick ratio is typically computed as: a....Ch. 12 - Prob. 18MCQCh. 12 - Prob. 19MCQCh. 12 - Prob. 20MCQCh. 12 - Prob. 21MCQCh. 12 - Prob. 22MCQCh. 12 - Prob. 23MCQCh. 12 - When analyzing a companys debt to equity ratio,...Ch. 12 - Prob. 25MCQCh. 12 - Prob. 26MCQCh. 12 - Prob. 27MCQCh. 12 - Prob. 28MCQCh. 12 - Prob. 29MCQCh. 12 - Prob. 30MCQCh. 12 - Which of the following ratios is used to measure...Ch. 12 - Prob. 32MCQCh. 12 - Selected information for Berry Company is as...Ch. 12 - Which of the following ratios is used to measure a...Ch. 12 - Prob. 35MCQCh. 12 - Prob. 36MCQCh. 12 - Prob. 37MCQCh. 12 - Prob. 38MCQCh. 12 - Which of the following are not part of common...Ch. 12 - Prob. 40MCQCh. 12 - Prob. 41MCQCh. 12 - Prob. 42MCQCh. 12 - Which of the following is not included in the...Ch. 12 - When a Dupont analysis reveals that a company has...Ch. 12 - Prob. 45MCQCh. 12 - Cross Sectional Analysis Cross sectional analysis...Ch. 12 - Prob. 47CECh. 12 - Prob. 48CECh. 12 - Short-Term Liquidity Ratios Three ratios...Ch. 12 - Debt Management Ratios Selected data from the...Ch. 12 - Debt Management and Short-Term Liquidity Ratios...Ch. 12 - Asset Efficiency Ratios Selected financial...Ch. 12 - Profitability Ratios The following data came from...Ch. 12 - Prob. 54CECh. 12 - Prob. 55CECh. 12 - Prob. 56CECh. 12 - Prob. 57BECh. 12 - Prob. 58BECh. 12 - Prob. 59BECh. 12 - Short-Term Liquidity Ratios Larry, Curly, and Moe...Ch. 12 - Debt Management Ratios Glow Corporation provides...Ch. 12 - Debt Management and Short-Term Liquidity Ratios...Ch. 12 - Asset Efficiency Ratios Rumsford Inc.s financial...Ch. 12 - Prob. 64BECh. 12 - Profitability Ratios Tinker Corporation operates...Ch. 12 - Profitability Ratios Katrina Corp. is a publicly...Ch. 12 - Prob. 67BECh. 12 - Prob. 68ECh. 12 - Prob. 69ECh. 12 - Prob. 70ECh. 12 - Prob. 71ECh. 12 - Horizontal Analysis of Income Statements...Ch. 12 - Prob. 73ECh. 12 - Prob. 74ECh. 12 - Prob. 75ECh. 12 - Prob. 76ECh. 12 - Prob. 77ECh. 12 - Prob. 78ECh. 12 - Prob. 79ECh. 12 - Asset Efficiency Ratios Refer to financial...Ch. 12 - Prob. 81ECh. 12 - Prob. 82ECh. 12 - Prob. 83ECh. 12 - Prob. 84PSACh. 12 - Prob. 85PSACh. 12 - Prob. 86PSACh. 12 - A Using Common Size Statements The following...Ch. 12 - Prob. 88PSACh. 12 - Prob. 89PSACh. 12 - Prob. 90PSACh. 12 - A Comparing Financial Ratios Presented below are...Ch. 12 - A Preparation of Ratios Refer to the financial...Ch. 12 - Accounting Alternatives and Financial Analysis...Ch. 12 - Prob. 84PSBCh. 12 - Prob. 85PSBCh. 12 - Prob. 86PSBCh. 12 - Prob. 87PSBCh. 12 - Prob. 88PSBCh. 12 - Prob. 89PSBCh. 12 - Prob. 90PSBCh. 12 - Comparing Financial Ratios Presented below are...Ch. 12 - Prob. 92PSBCh. 12 - Problem 1 2-93B Accounting Alternatives and...Ch. 12 - Prob. 94CCh. 12 - Prob. 95.1CCh. 12 - Prob. 95.2CCh. 12 - Prob. 96.1CCh. 12 - Prob. 96.2CCh. 12 - Prob. 97.1CCh. 12 - Prob. 97.2CCh. 12 - Prob. 97.3CCh. 12 - Prob. 97.4CCh. 12 - Analyzing Growth Consolidated financial statements...Ch. 12 - Analyzing Growth Consolidated financial statements...Ch. 12 - Prob. 98.1CCh. 12 - Prob. 98.2CCh. 12 - Prob. 98.3CCh. 12 - CONTINUING PROBLEM: FRONT ROW ENTERTAINMENT The...Ch. 12 - Prob. 99.2CCh. 12 - Prob. 99.3CCh. 12 - Prob. 99.4CCh. 12 - Prob. 99.5C
Knowledge Booster


Learn more about
Need a deep-dive on the concept behind this application? Look no further. Learn more about this topic, accounting and related others by exploring similar questions and additional content below.Similar questions
- Asset Efficiency Ratios Rumsford Inc.s financial statements for 2019 indicate the following account balances: Required: 1. Using this information, calculate Rumsfords receivable turnover ratio. (Note: Round to two decimal places.) 2. Using this information, calculate Rumsfords asset turnover ratio and also convert the ratio into days.arrow_forwardAnalyzing Fixed Assets Pitt reported the following information for 2018 and 2019: Required: Compute Pitts fixed asset turnover ratio and the average age of its fixed assets. ( Note: Round all answers to two decimal places.)arrow_forwardCalculate the following ratios for 2025 and 2026. (Round current ratio to 2 decimal places, e.g. 12.61, debts to assets and gross profit rate to 0 decimal places, e.g.12, and all other answers to 1 decimal place, e.g. 12.6%) Please show your work. 1. Current ratio 2. Debts to assets 3. Gross profit rate 4. Profit margin 5. Return on assets (Total assets at November 1, 2024, were $35,180) 6. Return on common stockholder's equity (Total common stockholders' equity at November 1, 2024, was $25, 180. Dividends on preferred stock were $16,800 in 2025 and $18,000 in 2026)arrow_forward
- Using the following Balance Sheet summary information, for the two years presented calculate the working capital for 2018 and 2019 respectively: Current Assets 12/31/2018 is $101,600/ 12/31/2019 is $97,350 current liabilities 12/31/2018 is $33,650/ 12/31/2019 is $32,800arrow_forwardPlease answer the asset management ratio of BPI from year 2018 - 2021.arrow_forwardUsing the following balance sheet summary information, for the two years presented calculate the current ratio for 2018 and 2019 respectively: current assets 101,600 97,350 current liabilities 33,650 32,800arrow_forward
- Using the attached balanced sheet and income statement Calculate the following ratios for the respective years: 2019, 2020, 2021 est Liquidity Ratios Current Ratio (times) Quick Ratio (times) Asset Management Ratios Average sales/day Inventory Turnover Ratio (times) Days Sales Outstanding (days) Fixed Assets Turnover Ratio (times) Total Asset Turnover Ratio Debt Management Ratios Total Debt to Total Assets (%) Times Interest Earned (times) Debt to Equity Ratio (%) Profitability Ratios Profit Margin on Sales (%) Earning Power (%) Return on Total Assets (%) Return on Common Equity (%) Market Value Ratios Price/Earnings Ratio Price/Earnings Ratio (times) Price/Cash Flow Ratio (times) Market /Book Value Ratio (times) Comment on the liquidity, profitability, leverage, asset management and market valuearrow_forwardCompute the following the financial data for the year. 4. Average sale period 5. Operating cycle 6. Total asset turnoverarrow_forwardlonic Exploration Company reported these figures for 2018 and 2017: E (Click the icon to view the figures.) Compute the rate of return on total assets for 2018. (Round to two decimals.) Select the formula, then enter the amounts to compute the rate of return on total assets for 2018. (Enter the rate of return as a percent rounded to two decimal places, X.XX%.) Rate of return on total assets %3D Data Table S: Income Statement-partial: 2018 2017 Interest Expense $ 17,800,000 $ 14,500,000 Net Income 18,400,000 14,600,000 Balance Sheet-partial: Dec. 31, 2018 Dec. 31, 2017 Total Assets $ 322,000,000 $ 320,000,000 Print Donearrow_forward
- 1. Compute the following ratios for the comparative periods (2018 and 2019). The company used 365 days in its computation for some of the ratios. Show your solution. a. Working Capital b. Current Ratio c. Acid Test Ratio d. Accounts Receivable Turnover Ratio e. Average Collection Period f. Inventory Turnover Ratio g. Average Days in Inventory h. Number of days in Operating Cycle i. Debt to Total Assets Ratio j. Debt to Equity Ratio k. Times Interest Earned Ratio l. Gross Profit Ratio m. Profit Margin Ratio n. Return on Assets o. Return on Equity p. Assets Turnover Ratioarrow_forwardcalculate the current ratio for 2018 and 2019 respectively: 2018 current assets 101,600, current liabilities 33,650 2019 current assets 97,350, current liabilities 32,800arrow_forwardLiverton Co.’s income statement for the year ended 31 March 2019 and statements of financial position at 31 March 2019 and 2018 were as follows in the images. Calculate for the financial year ended 31 March 2019 and, where possible, for 31 March 2018, the following ratios: i) Gross profit marginii) Assets usageiii) Current ratioiv) Acid testv) Inventories holding periodvi) Debt to Equity ratioarrow_forward
arrow_back_ios
SEE MORE QUESTIONS
arrow_forward_ios
Recommended textbooks for you
 Cornerstones of Financial AccountingAccountingISBN:9781337690881Author:Jay Rich, Jeff JonesPublisher:Cengage Learning
 Intermediate Accounting: Reporting And AnalysisAccountingISBN:9781337788281Author:James M. Wahlen, Jefferson P. Jones, Donald PagachPublisher:Cengage Learning
Cornerstones of Financial Accounting
Accounting
ISBN:9781337690881
Author:Jay Rich, Jeff Jones
Publisher:Cengage Learning
Intermediate Accounting: Reporting And Analysis
Accounting
ISBN:9781337788281
Author:James M. Wahlen, Jefferson P. Jones, Donald Pagach
Publisher:Cengage Learning
Financial ratio analysis; Author: The Finance Storyteller;https://www.youtube.com/watch?v=MTq7HuvoGck;License: Standard Youtube License