
Videos
a.
Test whether fatal bicycle accidents are equally likely to occur in each of the 12-months at 0.01 significance level.
a.
Answer to Problem 10E
There is convincing evidence that fatal bicycle accidents are not equally likely to occur in each of the months.
Explanation of Solution
Calculation:
The given data represent the classification of fatal bicycle accidents according to the month in which the accident occurred.
The expected counts are calculated as shown below:
| Month | Observed counts | Expected counts |
| January | 38 | |
| February | 32 | |
| March | 43 | |
| April | 59 | |
| May | 78 | |
| June | 74 | |
| July | 98 | |
| August | 85 | |
| September | 64 | |
| October | 66 | |
| November | 42 | |
| December | 40 | |
| 719 | 719 |
The nine-step hypotheses testing procedure to test goodness-of-fit is given below:
1. Consider that the proportion of fatal bicycle accidents occurring in January is
2. Null hypothesis:
3. Alternative hypothesis:
4. Significance level:
5. Test statistic:
6. Assumptions:
- Assume that the 719 accidents included in the study is a random sample from the population of fatal bicycle accidents.
- From the table, it is observed that all the expected counts are greater than 5.
7. Calculation:
Software procedure:
Step-by-step procedure to obtain the test statistics and P-value using the MINITAB software:
- Choose Stat > Tables > Chi-Square Goodness-of-Fit Test (One Variable).
- In Observed counts, enter the column of Number of Accidents.
- In Category names, enter the column of Month.
- Under Test, select the Equal Proportions.
- Click OK.
The output obtained using the MINITAB software is given below:
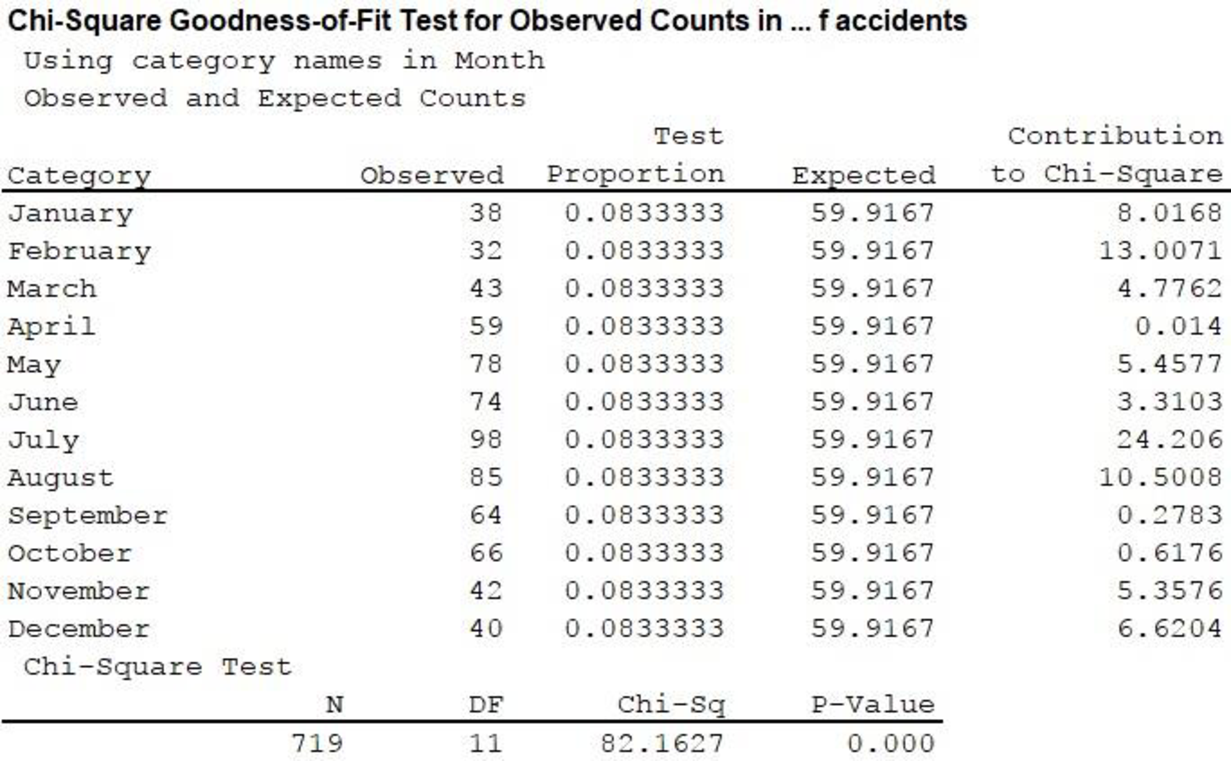
From the output,
8. P-value:
From the MINITAB output,
9. Conclusion:
Decision rule:
- If P-value is less than or equal to the level of significance, reject the null hypothesis.
- Otherwise, do not reject the null hypothesis.
Conclusion:
Here the level of significance is 0.01.
Here, P-value is less than the level of significance.
That is,
Hence, reject the null hypothesis. Therefore, there is convincing evidence that fatal bicycle accidents are not equally likely to occur in each of the months.
b.
Write the null and alternative hypotheses to determine if some months are riskier than others by taking differing month lengths into account.
b.
Explanation of Solution
The null hypothesis in Part (a) specifies that fatal accidents are equally likely to occur in any of the 12 months.
The year considered in the study is 2004, which is a leap year. It is known that a leap year contains 366 days, with 29 days in February.
The null and alternative hypotheses to determine if some months are riskier than others by taking differing month lengths and the characteristics of a leap year into account are as follows:
Null hypothesis:
Alternative hypothesis:
c.
Test the hypotheses proposed in Part (b) at 0.05 significance level.
c.
Answer to Problem 10E
There is convincing evidence that fatal bicycle accidents do not occur in any of the twelve months in proportion to the lengths of the months.
Explanation of Solution
Calculation:
The expected counts are calculated as shown below:
| Month | Observed counts |
Proportion | Expected counts |
| January | 38 | 0.085 | |
| February | 32 | 0.079 | |
| March | 43 | 0.085 | |
| April | 59 | 0.082 | |
| May | 78 | 0.085 | |
| June | 74 | 0.082 | |
| July | 98 | 0.085 | |
| August | 85 | 0.085 | |
| September | 64 | 0.082 | |
| October | 66 | 0.085 | |
| November | 42 | 0.082 | |
| December | 40 | 0.085 | |
| 719 | 1 (approximately) | 719 |
Significance level:
Test statistic:
Assumptions:
- Assume that the 719 accidents included in the study is a random sample from the population of fatal bicycle accidents.
- From the table, it is observed that all the expected counts are greater than 5.
Calculation:
Software procedure:
Step-by-step procedure to obtain the test statistic and P-value using the MINITAB software:
- Choose Stat > Tables > Chi-Square Goodness-of-Fit Test (One Variable).
- In Observed counts, enter the column of Number of Accidents.
- In Category names, enter the column of Month.
- Under Test, select the column of Proportion in Proportions specified by historical counts.
- Click OK.
The output obtained using the MINITAB software is given below:
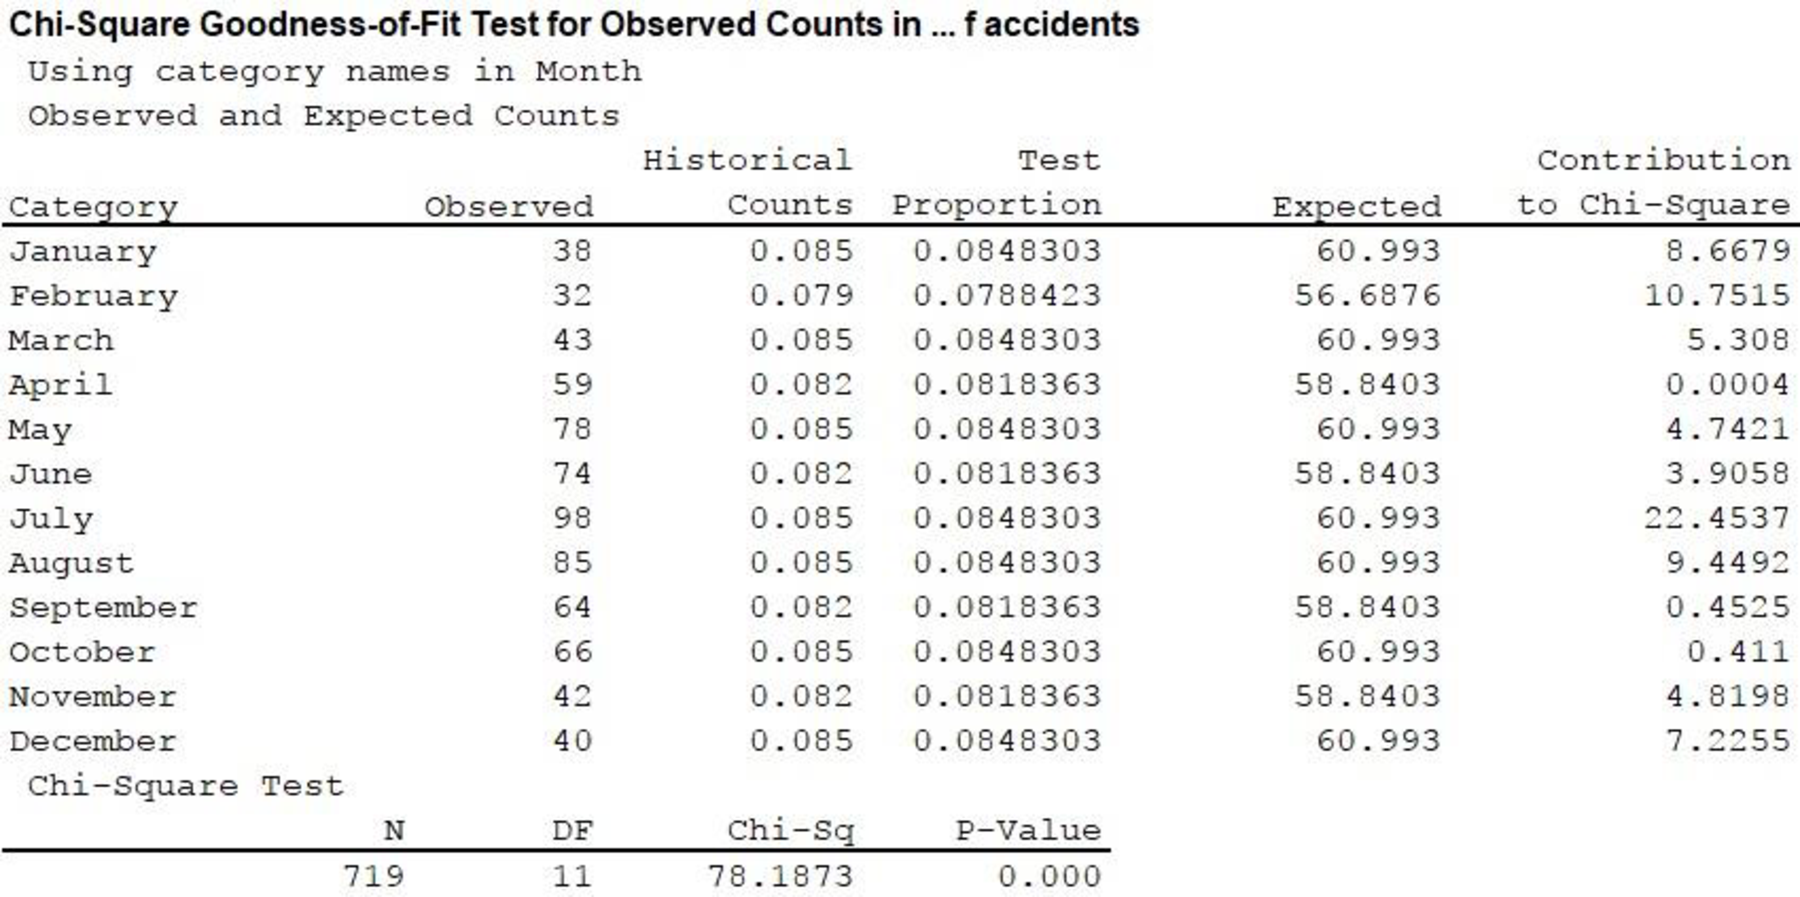
From the output,
8. P-value:
From the MINITAB output,
9. Conclusion:
Decision rule:
- If P-value is less than or equal to the level of significance, reject the null hypothesis.
- Otherwise, do not reject the null hypothesis.
Conclusion:
Here the level of significance is 0.05.
Here, P-value is less than the level of significance.
That is,
Hence, reject the null hypothesis.
Therefore, there is convincing evidence that fatal bicycle accidents do not occur in any of the twelve months in proportion to the lengths of the months.
Want to see more full solutions like this?
Chapter 12 Solutions
INTRO.TO STATS.+DATA ANALYS. W/WEBASSI


 Holt Mcdougal Larson Pre-algebra: Student Edition...AlgebraISBN:9780547587776Author:HOLT MCDOUGALPublisher:HOLT MCDOUGAL