
Concept explainers
Videos
Check whether it is reasonable to conclude that the response proportions are not the same for all five countries at 0.01 significance level.
Answer to Problem 37CR
There is convincing evidence that the response proportions are not all the same for all five countries.
Explanation of Solution
Calculation:
The given data represent classifications of different countries for the response to the question of torture against suspected terrorists to obtain information about the terrorism activities.
The steps in chi-square test for homogeneity are as follows:
Null and alternative Hypotheses:
Null hypothesis:
Alternative hypothesis:
Level of significance:
Assumptions:
- It is given that the samples are random samples.
- The expected cell counts are calculated as shown below:
| Country | Response | Total | ||||
| Never | Rarely | Sometimes | Often | Not Sure | ||
| Country I | 1,000 | |||||
| Country S | 1,000 | |||||
| Country F | 1,000 | |||||
| Country U | 1,000 | |||||
| Country SK | 1,000 | |||||
| Total | 2,000 | 1,110 | 1,220 | 450 | 220 | 5,000 |
From the expected cell counts table, it is observed that all the expected counts are greater than 5.
Test Statistic:
Software procedure:
Step-by-step procedure to obtain the test statistic and P-value using the MINITAB software:
- Choose Stat > Tables > Cross Tabulation and Chi-Square.
- Select Summarized data in two-way table.
- In Columns containing the table, enter the columns of Never, Rarely, Sometimes, Often, and Not Sure.
- Check Chi-square test under Chi-square.
- Click OK.
Output using the MINITAB software is given below:
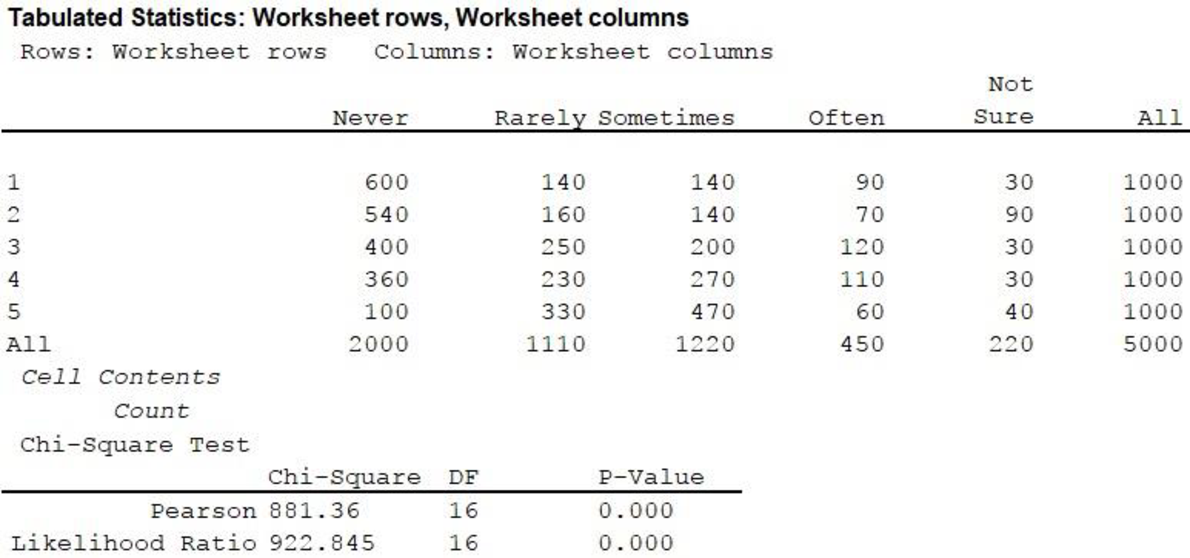
From the output,
P-value:
From the MINITAB output, P-value is 0.000.
Decision rule:
- If P-value is less than or equal to the level of significance, reject the null hypothesis.
- Otherwise, fail to reject the null hypothesis.
Conclusion:
Here the level of significance is 0.01.
Here, P-value is less than the level of significance.
That is,
Hence, reject the null hypothesis.
Therefore, there is convincing evidence that the response proportions are not the same for all the five countries at 0.01 significance level.
Want to see more full solutions like this?
Chapter 12 Solutions
INTRO.TO STATS.+DATA ANALYS. W/WEBASSI


 Holt Mcdougal Larson Pre-algebra: Student Edition...AlgebraISBN:9780547587776Author:HOLT MCDOUGALPublisher:HOLT MCDOUGAL
 College Algebra (MindTap Course List)AlgebraISBN:9781305652231Author:R. David Gustafson, Jeff HughesPublisher:Cengage Learning