
Concept explainers
Videos
The paper “Sociochemosensory and Emotional
One of the three shirts had been worn by the subject’s roommate. The subject was asked to identify the shirt worn by her roommate. This process was then repeated with another three shirts, and the number of times out of the two trials that the subject correctly identified the shirt worn by her roommate was recorded. The resulting data are summarized in the accompanying table.
![Chapter 12.1, Problem 10E, The paper Sociochemosensory and Emotional Functions (Psychological Science [2009]: 11181124)](https://content.bartleby.com/tbms-images/9781337793612/Chapter-12/images/93612-12.1-10e-question-digital_image_001.png)
- a. Can a person identify her roommate by smell? If not, the data from the experiment should be consistent with what we would have expected to see if subjects were just guessing on each trial. That is, we would expect that the probability of selecting the correct shirt would be 1/3 on each of the two trials.
Calculate the proportions of the time we would expect to see 0, 1, and 2 correct identifications if subjects are just guessing. (Hint: 0 correct identifications occurs if the first trial is incorrect and the second trial is incorrect.)
- b. Use the three proportions calculated in Part (a) to carry out a test to determine if the numbers of correct identifications by the students in this study are significantly different from what would have been expected by guessing. Use α = 0.05. (Note: One of the expected counts is just a bit less than 5. For purposes of this exercise, assume that it is OK to proceed with a goodness-of-fit test.)
a.
Calculate the proportion of time expected to see 0, 1, and 2 correct identifications if subjects are just guessing.
Answer to Problem 10E
When the subjects are just guessing, the proportion of time expected to see 0, 1, and 2 correct identifications are
Explanation of Solution
Calculation:
It is given that if subjects were just guessing on each trial, the probability of selecting the correct shirt would be
Thus, the probability of selecting the wrong shirt is
The proportion of 0 correct identifications expected in two trials is shown below.
The proportion of 1 correct identifications expected in two trials is shown below.
The proportion of 2 correct identifications expected in two trials is shown below
b.
Test whether the numbers of correct identifications by the students in this study are significantly different from what would have been expected by guessing at 0.05 level of significance.
Answer to Problem 10E
The numbers of correct identifications by the students in this study are significantly different from those that would have been expected by guessing.
Explanation of Solution
The given data represents the number of correct identifications of shirt worn by her roommate in two trials.
The expected counts can be calculated using the formula,
| Number of correct identification | Observed Frequency | Expected counts |
| 0 | 21 | |
| 1 | 10 | |
| 2 | 13 | |
| Total | 44 | 44 |
The nine step hypotheses testing procedure to test goodness-of-fit is given below.
1. The proportion of correct identifications are
2. Null hypothesis:
3. Alternative hypothesis:
4. Significance level:
5. Test statistic:
6. Assumptions:
- Randomness assumption is not necessary, as the question is only to test whether the observed counts differ from expected by guessing.
- From the table above, it is observed that one of the expected counts is a little less than 5. However, as per the instruction, the goodness-of-fit test can be done.
7. Calculation:
Software procedure:
Step-by-step procedure to obtain the test statistics and P-value using the MINITAB software:
- Choose Stat > Tables > Chi-Square Goodness-of-Fit Test (One Variable).
- In Observed counts, enter the column of Observed count.
- In Category names, enter the column of Number of correct identification.
- Under Test, select the column of Proportion in Proportions specified by historical counts.
- Click OK.
Output using the MINITAB software is given below:
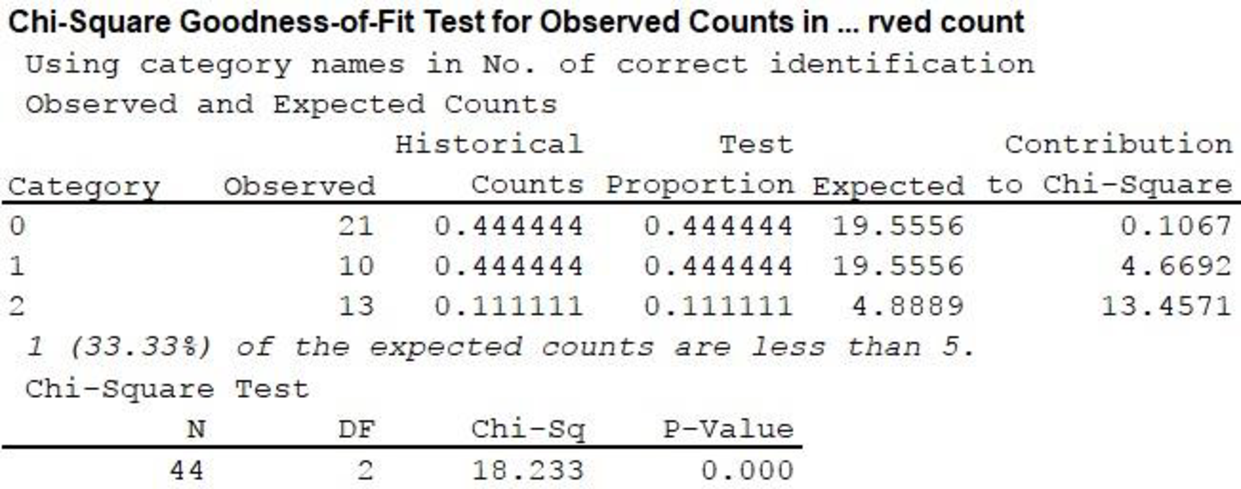
From the output,
8. P-value:
From the MINITAB output,
9. Conclusion:
Decision rule:
- If P-value is less than or equal to the level of significance, reject the null hypothesis.
- Otherwise fail to reject the null hypothesis.
Conclusion:
Here the level of significance is 0.05.
Here, P-value is less than the level of significance.
That is,
Therefore, reject the null hypothesis. Hence, the numbers of correct identifications by the students in this study are significantly different from those that would have been expected by guessing.
Want to see more full solutions like this?
Chapter 12 Solutions
Introduction To Statistics And Data Analysis


- The following data are taken from an experiment in which the subjects were tested for motion sickness. Thesubjects were randomly assigned to either the control group which was given a placebo or the experimentalgroup which was given the drug Astemizole and observed on an ocean voyage. The same subjects were thenswitched and those that had the placebo were now given the drug, and those that had the drug were nowgiven a placebo and observed on a new ocean voyage taking the same course. The results are the number ofhead movements that the subjects could endure without becoming nauseous. Use α = 0.05 to test the claimthat Astemizole is effective, i.e. it takes a larger number of head movements before the subject getsnauseous.Control 19 45 36 42 38 31 30 40 41 35Drug 20 55 36 45 40 32 41 38 44 29 1) State the hypotheses and identify the claim. Group 1 is the Control group. 2)Find the test statistic and Find the p-value. 3)Make the decision and Summarize the results.arrow_forwardThe article “Effects of Diets with Whole Plant-Origin Proteins Added with Different Ratiosof Taurine:Methionine on the Growth, Macrophage Activity and Antioxidant Capacity ofRainbow Trout (Oncorhynchus mykiss) Fingerlings” (O. Hernandez, L. Hernandez, et al.,Veterinary and Animal Science, 2017:4-9) reports that a sample of 210 juvenile rainbowtrout fed a diet fortified with equal amounts of the amino acids taurine and methionine for aperiod of 70 days had a mean weight gain of 313 percent with a standard deviation of 25, while 210 fish fed with a control diet had a mean weight gain of 233 percent with a standard deviation of 19. Units are percent. Find a 99% confidence interval for the difference in weight gain on the two diets.arrow_forwardIn this study, ten combat veterans undergoing treatment for PTSD were randomly sampled from a local VA hospital in a study designed to test the efficacy of an anti-anxiety medication in reducing the symptoms of PTSD. Based on clinical animal trials, the researchers predict that the drug should reduce symptoms. t= 1.63, df=9, p=0.064, d= 0.529. Before: M= 48.100, SD=1.370, SE=0.433 After: M= 47.000, SD= 1.491, SE= 0.471 My hypotheses are; H0: μbefore ≤ μafter. H1: μbefore > μafter A. State your findings in APA format: B. How would you explain these findings to someone who has never taken a statistics class? In other words, use clear direct, non-jargon language to explain the results:arrow_forward
- A paper investigated the driving behavior of teenagers by observing their vehicles as they left a high school parking lot and then again at a site approximately 1 2 mile from the school. Assume that it is reasonable to regard the teen drivers in this study as representative of the population of teen drivers. MaleDriver FemaleDriver 1.3 -0.3 1.3 0.6 0.9 1.1 2.1 0.7 0.7 1.1 1.3 1.2 3 0.1 1.3 0.9 0.6 0.5 2.1 0.5 (a) Use a .01 level of significance for any hypothesis tests. Data consistent with summary quantities appearing in the paper are given in the table. The measurements represent the difference between the observed vehicle speed and the posted speed limit (in miles per hour) for a sample of male teenage drivers and a sample of female teenage drivers. (Use ?males − ?females. Round your test statistic to two decimal places. Round your degrees of freedom down to the nearest whole number. Round your p-value to three decimal places.) t = df =…arrow_forwardA paper investigated the driving behavior of teenagers by observing their vehicles as they left a high school parking lot and then again at a site approximately 1 2 mile from the school. Assume that it is reasonable to regard the teen drivers in this study as representative of the population of teen drivers. MaleDriver FemaleDriver 1.4 -0.2 1.2 0.5 0.9 1.1 2.1 0.7 0.7 1.1 1.3 1.2 3 0.1 1.3 0.9 0.6 0.5 2.1 0.5 (a) Use a .01 level of significance for any hypothesis tests. Data consistent with summary quantities appearing in the paper are given in the table. The measurements represent the difference between the observed vehicle speed and the posted speed limit (in miles per hour) for a sample of male teenage drivers and a sample of female teenage drivers. (Use ?males − ?females. Round your test statistic to two decimal places. Round your degrees of freedom down to the nearest whole number. Round your p-value to three decimal places.) t = df =…arrow_forwardA researcher conducted a medical study to investigate whether taking a low-dose aspirin reduces the chance of developing colon cancer. As part of the study, 1,000 adult volunteers were randomly assigned to one of two groups. Half of the volunteers were assigned to the experimental group that took a low-dose aspirin each day, and the other half were assigned to the control group that took a placebo each day. At the end of six years, 15 of the people who took the low-dose aspirin had developed colon cancer and 26 of the people who took the placebo had developed colon cancer. At the significance level α = 0.05, do the data provide convincing statistical evidence that taking a low-dose aspirin each day would reduce the chance of developing colon cancer among all people similar to the volunteers?arrow_forward
- In a study of a group of women science majors who remained in their profession and a group who left their profession within a few months of graduation, the researchers collected the data shown here on a self-esteem questionnaire. Leavers Stayers 1 = 3.09 2 = 2.93 σ1 = 0.75 σ2 = 0.75 n1 = 101 n2 = 221 At α = 0.05, can it be concluded that there is a difference in the self-esteem scores of the two groups? Use the P-value method. Group of answer choicesarrow_forwardThe following is an abstract from the journal Exceptional Children (O’Connor, White, & Swanson, 2007): Abstract: This research evaluated two methods to improve the reading fluency of struggling readers. Poor readers in grades 2 and 4 with (n = 17) and without (n = 20) learning disabilities were randomly assigned to one of two fluency practice variations or to a control group. Students in the treatments practiced reading aloud under repeated or continuous reading conditions with an adult listener in 15-min sessions, 3 days per week for 14 weeks. For students in the treatment conditions, growth curve analyses revealed significant differences in fluency and reading comprehension over students in the control. We found no significant differences between practice conditions. Consider the following elements in this study: (1) poor readers (2) students in grades 2 and 4 (3) students with and without learning disabilities (4) reading aloud with an adult listener or not (5) repeated or…arrow_forwardFrom the following data, test whether there is any association betweenintelligence and economic conditions of 1000 students.EconomicConditionIntelligenceExcellent Good Medium Dull TotalGood 48 200 150 80 478Not good 52 180 190 100 522Total 100 380 340 180 1000arrow_forward
- Compute for the Two way ANOVA or F-Test in an experiment designed to evaluate three detergents, a laboratory ran three loads of washing at each combination of detergents and water temperatures and obtained the following whiteness readings: Detergent A Detergent B Detergent c Cold Water 45, 39, 46 43, 46, 41 55, 48, 53 Warm Water 37, 32, 43 40, 37, 46 56, 51, 53 Hot Water 42, 42, 46 44, 45, 38 46, 49, 42 Use the 0.01 level of significance to test for differences among the detergents, differences due to water temperature, and differences due to interactions.arrow_forwardA group of high-risk automobile drivers (with three moving violations in one year) are required, according to random assignment, either to attend a traffic school or to perform supervised volunteer work. During the subsequent five-year period, these same drivers were cited for the following number of moving violations: NUMBER OF MOVING VIOLATIONS TRAFFIC SCHOOL VOLUNTEER WORK 0 26 0 7 15 4 9 1 7 1 0 14 2 6 23 10 7 8 Why might the Mann–Whitney U test be preferred to the t test for these data? Use U to test the null hypothesis at the .05 level of significance. Specify the approximate p-value for this test result.arrow_forwardA psychologist at a private mental hospital was asked to determine whether there was a clear difference in the length of stay for patients with different categories of diagnosis. Looking at the last four patients in each of the three major categories, the results (in terms of weeks of stay) were as follows: Diagnosis Category Affective Disorders Cognitive Disorders Drug-Related Conditions 7 12 8 6 8 10 5 9 12 6 11 10 Using alpha = 0.05, is there a significant difference in length of stay among diagnosis categories? Show all five steps of hypothesis testing. For additional practice, compute the means and standard deviations for each group. What is the purpose of a post hoc test? What does it tell us? Explain why we do not need a post hoc test if there are only two groups in our study. Conduct Tukey's HSD post hoc test to determine where there is a difference in the three groups.arrow_forward
 MATLAB: An Introduction with ApplicationsStatisticsISBN:9781119256830Author:Amos GilatPublisher:John Wiley & Sons Inc
 Probability and Statistics for Engineering and th...StatisticsISBN:9781305251809Author:Jay L. DevorePublisher:Cengage Learning
 Statistics for The Behavioral Sciences (MindTap C...StatisticsISBN:9781305504912Author:Frederick J Gravetter, Larry B. WallnauPublisher:Cengage Learning
 Elementary Statistics: Picturing the World (7th E...StatisticsISBN:9780134683416Author:Ron Larson, Betsy FarberPublisher:PEARSON
 The Basic Practice of StatisticsStatisticsISBN:9781319042578Author:David S. Moore, William I. Notz, Michael A. FlignerPublisher:W. H. Freeman
 Introduction to the Practice of StatisticsStatisticsISBN:9781319013387Author:David S. Moore, George P. McCabe, Bruce A. CraigPublisher:W. H. Freeman