Essentials Of Statistics For Business & Economics
9th Edition
ISBN: 9780357045435
Author: David R. Anderson, Dennis J. Sweeney, Thomas A. Williams, Jeffrey D. Camm, James J. Cochran
Publisher: South-Western College Pub
expand_more
expand_more
format_list_bulleted
Textbook Question
Chapter 12.1, Problem 3E
Late Flight Comparison Across Airlines. The sample data below represent the number of late and on time flights for Delta, United, and US Airways.
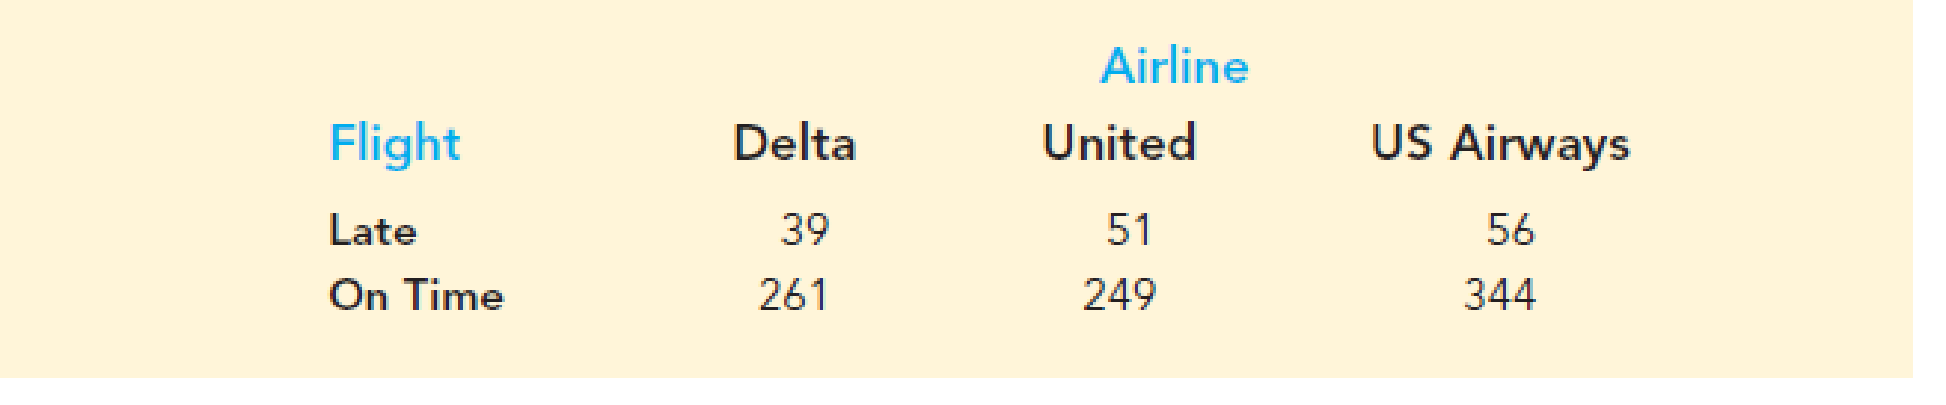
a. Formulate the hypotheses for a test that will determine if the population proportion of late flights is the same for all three airlines.
b. Conduct the hypothesis test with a .05 level of significance. What is the p-value and what is your conclusion?
c. Compute the sample proportion of late flights for each airline. What is the overall proportion of late flights for the three airlines?
Expert Solution & Answer

Trending nowThis is a popular solution!

Students have asked these similar questions
In a bowling tournament, a team has won 15 of its last 20 games.
Based on this information, what is the probability that it will win:
a) at least 4 of the remaining 10?
b) exactly 4 of the remaining 10?
c) more than 4 of its remaining 10?
d) Construct a graph of the probability distribution.
Determine whether a probability distribution exists. If a probability distribution exists,
find its mean and standard deviation. If a probability distribution does not exist, identify the
requirements that are not met.
Fun Ways to Flirt A sociologist randomly selects single adults into groups of three,
and the random variable x is the number of people in the group who say the most fun way to
flirt is in person (based on a Microsoft instant messenger survey).
P(x)
0
0.091
1
0.334
2
0.408
3
0.166
Determine whether a probability distribution exists. If a probability distribution exists,
find its mean and standard deviation. If a probability distribution does not exist, identify the
requirements that are not met.
Fun Ways to Flirt In a Microsoft Instant Messenger survey, respondents were asked to
choose the funniest way to flirt, and the attached table is based on the results.
P(x)
Email
0.06
In person
0.55
Instant message
0.24
Text message
0.15
Chapter 12 Solutions
Essentials Of Statistics For Business & Economics
Ch. 12.1 - Use the sample data below to test the...Ch. 12.1 - reconsider the observed frequencies in exercise 1...Ch. 12.1 - Late Flight Comparison Across Airlines. The sample...Ch. 12.1 - Electronic Component Supplier Quality Comparison....Ch. 12.1 - Research Classification of Higher Education. The...Ch. 12.1 - Error Rates in Tax Preparation. A tax preparation...Ch. 12.1 - Use of Social Media. Social media is becoming more...Ch. 12.1 - Supplier Quality: Three Inspection Outcomes. The...Ch. 12.2 - The following table contains observed frequencies...Ch. 12.2 - The following table contains observed frequencies...
Ch. 12.2 - Airline Ticket Purchases for Domestic and...Ch. 12.2 - Hiring and Firing Plans at Private and Public...Ch. 12.2 - Generational Differences in Workplace Attitudes....Ch. 12.2 - Vehicle Quality Ratings. A J. D. Power and...Ch. 12.2 - Company Reputation and Management Quality Survey....Ch. 12.2 - Academy Awards and Movie Fan Sentiment. The race...Ch. 12.2 - Amount of Sleep by Age Group. The National Sleep...Ch. 12.2 - Prob. 18ECh. 12.3 - Test the following hypotheses by using the 2...Ch. 12.3 - The following data are believed to have come from...Ch. 12.3 - Television Audiences Across Networks. During the...Ch. 12.3 - M&M Candy Colors. Mars, Inc. manufactures M&M’s,...Ch. 12.3 - Shareholder Scoreboard Ratings. The Wall Street...Ch. 12.3 - Traffic Accidents by Day of Week. The National...Ch. 12.3 - Daily High Temperatures. Bob Feller, an Iowa...Ch. 12.3 - Weekly Demand at Whole Foods Market. The manager...Ch. 12 - Where Millionaires Live in America. In a 2018...Ch. 12 - Quality Comparison Across Production Shifts....Ch. 12 - Ratings of Most-Visited Art Museums. As listed by...Ch. 12 - Pace-of-Life Preference By Gender. A Pew Research...Ch. 12 - Church Attendance by Age Group. The Barna Group...Ch. 12 - Ambulance Calls by Day of Week. An ambulance...Ch. 12 - Attitudes Toward New Nuclear Power Plants. A...Ch. 12 - America’s Favorite Sports. The Harris Poll tracks...Ch. 12 - Best-Selling Small Cars in America. Based on 2017...Ch. 12 - Prob. 36SECh. 12 - Testing If Daily Sales Obey a Binomial Probability...Ch. 12 - In a study conducted by Zogby International for...Ch. 12 - Six months ago, Fuentes Salty Snacks, Inc., added...Ch. 12 - Fresno Board Games manufactures and sells several...
Knowledge Booster
Learn more about
Need a deep-dive on the concept behind this application? Look no further. Learn more about this topic, statistics and related others by exploring similar questions and additional content below.Similar questions
- In an electrical products industry, as part of a quality control test, a batch of 300 electrical fuses is selected, which is known to contain 5% defective fuses. A sample of 5 fuses is taken to verify their condition. Determine the probability that: a) One fuse is defective b) Two fuses are defective c) At least one is defective d) All five are defective e) Construct the probability distribution grapharrow_forwardAnswer the problem please.arrow_forwardcan wr define each section pleasearrow_forward
- A number of years ago, there was a popular television game show called Let's Make a Deal. The host, Monty Hall, would randomly select contestants from the audience and, as the title suggests, he would make deals for prizes. Contestants would be given relatively modest prizes and then would be offered the opportunity to risk that prize to win better ones. Suppose a contestant on this show, On the stage are three curtains, A, B, and C. Behind one of them is a brand-new car worth $45,000. Behind the other two curtains, the stage is empty.mthey must now select one of the curtains. Suppose you select Curtain A.In an attempt to make things more interesting, Monty then exposes an empty stage by opening Curtain C (note: he knows that there is nothing behind Curtain C). He then asks if they want to keep Curtain A, or switch to Curtain B.What should they do? Keep Curtain A or switch to Curtain B?arrow_forward> than m... 1/5 Saray A binomial experiment with probability of success p=0.16 and = 7 trials is conducted. What is the probability that the experiment results in more than 1 success? Do not round your intermediate computations, and round your answer to three decimal places. (If necessary, consult a list of formulas.) o search E C 105°F E Explanation Check 2025 McGraw Hill LLC. All Rights Reserved. Terms of Use | Privacy Center | Accessibilityarrow_forwardfind an article that includes a reference to the use of probability in a real life situation. These articles/videos might be discussing weather events, investing outcomes, or sports performance, among many other possible topicsarrow_forward
- Good Day, Kindly assist with this query. Any assistance would be appreciated. Compute R2 Is the latter significant different from zero?arrow_forwardThe following table describes the probability distribution of the number of Mexican-Americans serving on a 12-member jury in Hidalgo County, Texas. Assuming we repeat the random selection process for the 12 jurors and count the number of Mexican-Americans each time, calculate the mean number of Mexican-Americans (out of 12), the variance, and the standard deviation. Use these results and the interval rule of thumb to calculate the highest common value and the lowest common value. Based on the results, determine whether a jury consisting of 7 Mexican-Americans out of 12 jurors is common or uncommon. Probability distribution: probabilities of numbers of Mexican-Americans on a 12-member jury, assuming the members are randomly selected from a population in which 80% of the inhabitants are Mexican-American x (méxico- estadouni- P(x) denses) 0 0+ 1 0+ 2 0+ 3 0+ 4 0.001 5 0.003 6 0.016 7 0.053 8 0.133 9 0.236 10 0.283 11 0.206 12 0.069arrow_forwarda) When two variables are correlated, can the researcher be sure that one variable causes the other? If YES , why? If NO , why? b) What is meant by the statement that two variables are related? Discuss with examples.arrow_forward
- Good Day, assist me with plotting the following. I've already calculated the System Average Interruption Duration Index and System Average Interruption Frequency Index. using this data Create time series plots form the reliability metrics SAIDI and SAIFI along with thetrend lines based on the linear regression SAIDI(MINUTES) SAIFI(Interruptions) 2.58 0.045 2.94 0.056 2.32 0.056 3.21 0.177 2.78 0.180 2.72 0.121 2.44 0.119 3.19 0.175 2.21 0.065 2.30 0.135 3.49 0.128 3.60 0.112 2.15 0.104 3.75 0.055 3.12 0.036 2.85 0.123 2.62 0.173 3.08 0.047 1.92 0.040 2.94 0.147arrow_forwardFinish times (to the nearest hour) for 10 dogsled teams are shown below. Make a frequency table showing class limits, class boundaries, midpoints, frequency, relative frequencies, and cumulative frequencies. Use three classes. The class size of the given data is 25. (Round your answer for relative frequency to the nearest hundredth and for midpoint to the nearest tenth.) 262 236 272 256 294 242 288 258 284 310arrow_forwardwhat do you learn in math534 (Applied Managerial Statistics) where Applied Managerial Statistics stresses the practical use of statistics in collecting, organizing, analyzing, interpreting, and presenting data. Both descriptive and inferential techniques are covered ?arrow_forward
arrow_back_ios
SEE MORE QUESTIONS
arrow_forward_ios
Recommended textbooks for you
- College Algebra (MindTap Course List)AlgebraISBN:9781305652231Author:R. David Gustafson, Jeff HughesPublisher:Cengage LearningHolt Mcdougal Larson Pre-algebra: Student Edition...AlgebraISBN:9780547587776Author:HOLT MCDOUGALPublisher:HOLT MCDOUGALGlencoe Algebra 1, Student Edition, 9780079039897...AlgebraISBN:9780079039897Author:CarterPublisher:McGraw Hill
- Big Ideas Math A Bridge To Success Algebra 1: Stu...AlgebraISBN:9781680331141Author:HOUGHTON MIFFLIN HARCOURTPublisher:Houghton Mifflin Harcourt

College Algebra (MindTap Course List)
Algebra
ISBN:9781305652231
Author:R. David Gustafson, Jeff Hughes
Publisher:Cengage Learning

Holt Mcdougal Larson Pre-algebra: Student Edition...
Algebra
ISBN:9780547587776
Author:HOLT MCDOUGAL
Publisher:HOLT MCDOUGAL

Glencoe Algebra 1, Student Edition, 9780079039897...
Algebra
ISBN:9780079039897
Author:Carter
Publisher:McGraw Hill


Big Ideas Math A Bridge To Success Algebra 1: Stu...
Algebra
ISBN:9781680331141
Author:HOUGHTON MIFFLIN HARCOURT
Publisher:Houghton Mifflin Harcourt
Hypothesis Testing using Confidence Interval Approach; Author: BUM2413 Applied Statistics UMP;https://www.youtube.com/watch?v=Hq1l3e9pLyY;License: Standard YouTube License, CC-BY
Hypothesis Testing - Difference of Two Means - Student's -Distribution & Normal Distribution; Author: The Organic Chemistry Tutor;https://www.youtube.com/watch?v=UcZwyzwWU7o;License: Standard Youtube License