Mathematics for the Trades: A Guided Approach (10th Edition) - Standalone book
10th Edition
ISBN: 9780133347777
Author: Robert A. Carman Emeritus, Hal M. Saunders
Publisher: PEARSON
expand_more
expand_more
format_list_bulleted
Concept explainers
Videos
Textbook Question
Chapter 12.1, Problem 6AE
Automotive Trades The following line graph shows how the average fuel economy of a selected group of automobiles varies according to the speed of the vehicle.
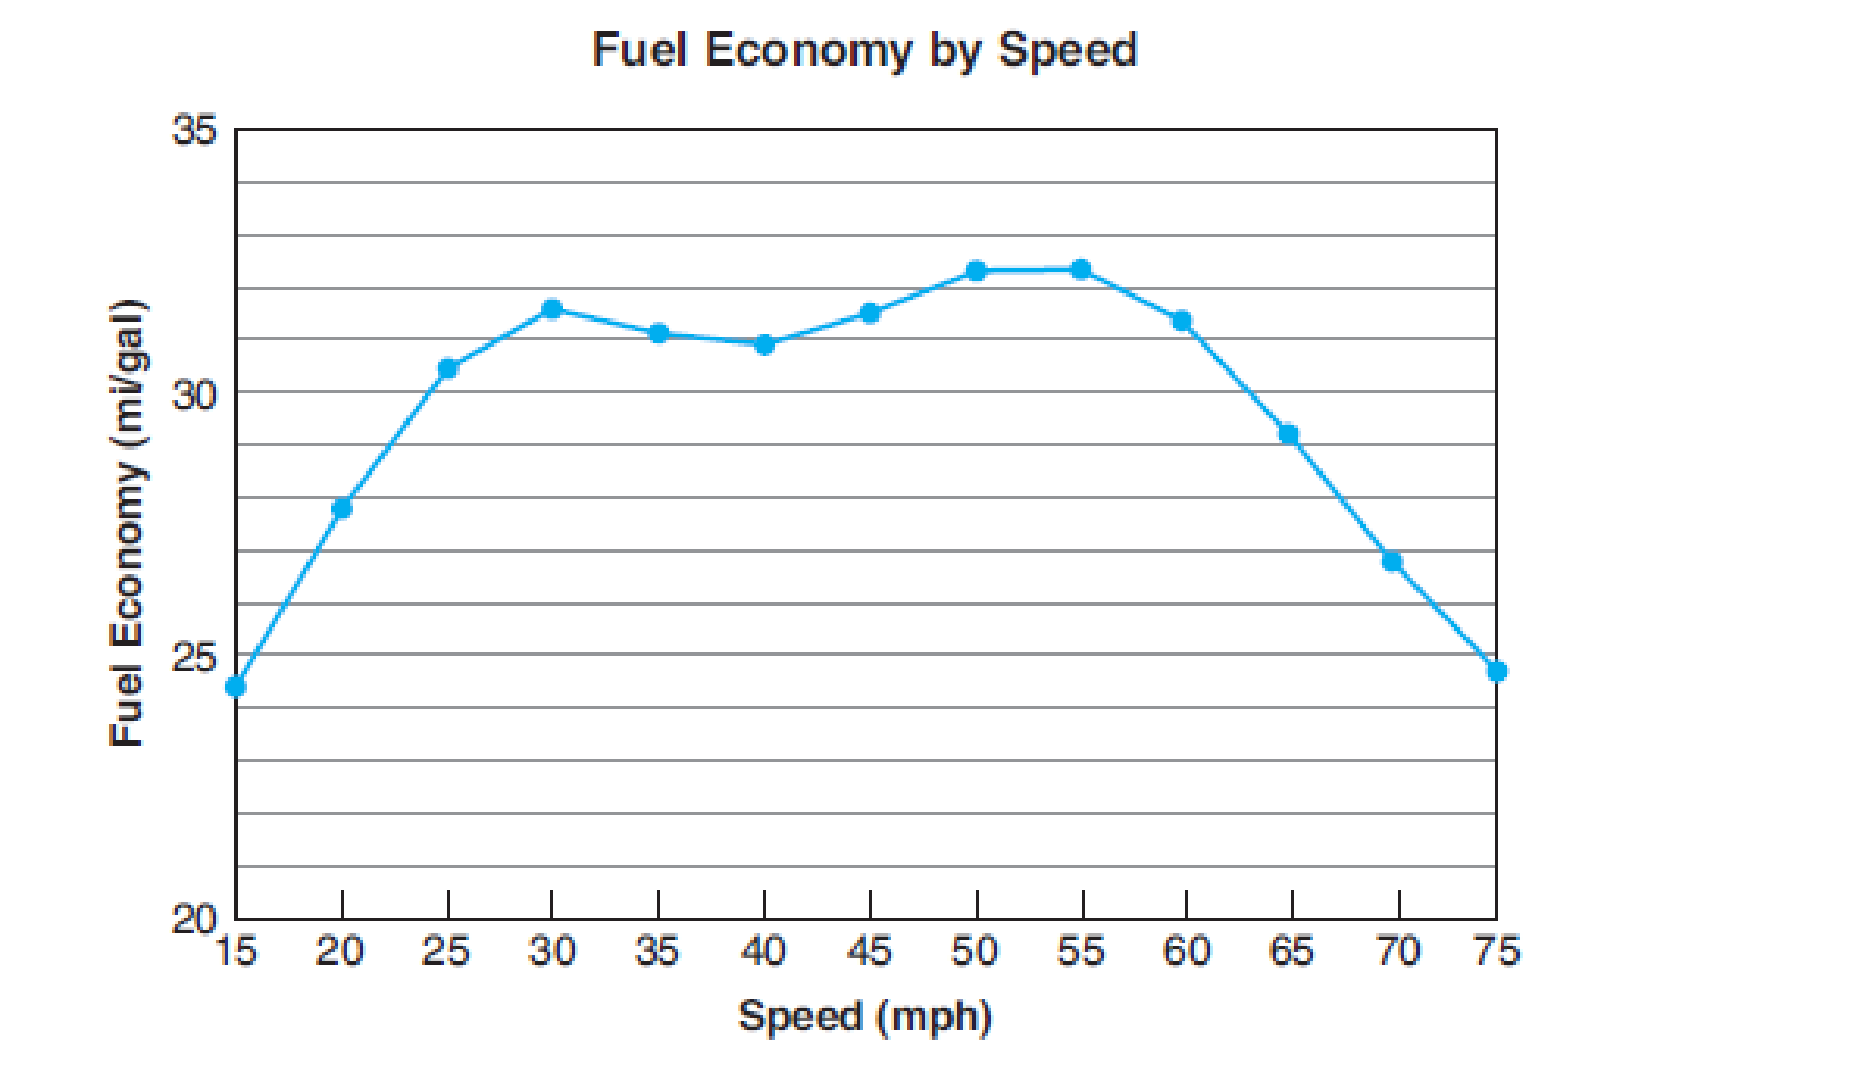
- (a) At what speed is fuel economy the best? The worst?
- (b) What is the fuel economy at 65 mph? At 40 mph?
- (c) At what speed is the fuel economy 29 mi/gal?
- (d) After which two speeds does fuel economy begin to decrease?
Expert Solution & Answer
Want to see the full answer?
Check out a sample textbook solution
Chapter 12 Solutions
Mathematics for the Trades: A Guided Approach (10th Edition) - Standalone book
Ch. 12.1 - A. Answer the questions following each...Ch. 12.1 - Trades Management The following graph shows the...Ch. 12.1 - Prob. 3AECh. 12.1 - Prob. 4AECh. 12.1 - Prob. 5AECh. 12.1 - Automotive Trades The following line graph shows...Ch. 12.1 - Prob. 7AECh. 12.1 - General Interest Study the circle graph at the top...Ch. 12.1 - Prob. 9AECh. 12.1 - Allied Health An assistant at a pharmaceutical...
Ch. 12.1 - Fire Protection Plot the following data as a bar...Ch. 12.1 - Transportation The following table lists the total...Ch. 12.1 - Metalworking Draw a bar graph from the following...Ch. 12.1 - Trades Management Plot the following data as a bar...Ch. 12.1 - Prob. 5BECh. 12.1 - General Interest The following table shows the...Ch. 12.1 - Prob. 7BECh. 12.1 - Trades Management The following table shows the...Ch. 12.1 - Prob. 9BECh. 12.1 - General Interest The following data show the world...Ch. 12.1 - Fire Protection The following data show the number...Ch. 12.1 - Prob. 12BECh. 12.1 - Hydrology The following table shows the daily...Ch. 12.1 - Business and Finance Plot a double broken-line...Ch. 12.1 - Prob. 15BECh. 12.1 - Prob. 16BECh. 12.1 - Aviation An aircraft mechanic spends 12.5% of a...Ch. 12.1 - General Interest Recent surveys have shown that...Ch. 12.2 - Find the mean, median, and mode for each set of...Ch. 12.2 - A. Find the mean, median, and mode for each set of...Ch. 12.2 - A. Find the mean, median, and mode for each set of...Ch. 12.2 - A. Find the mean, median, and mode for each set of...Ch. 12.2 - A. Find the mean, median, and mode for each set of...Ch. 12.2 - A. Find the mean, median, and mode for each set of...Ch. 12.2 - A. Find the mean, median, and mode for each set of...Ch. 12.2 - A. Find the mean, median, and mode for each set of...Ch. 12.2 - Construct an extended frequency distribution for...Ch. 12.2 - Construct an extended frequency distribution for...Ch. 12.2 - Aviation BF Goodrich produces brake pads for...Ch. 12.2 - Prob. 2CECh. 12.2 - Prob. 3CECh. 12.2 - Prob. 4CECh. 12.2 - Automotive Trades A mechanic has logged the...Ch. 12.2 - Forestry A forest ranger wishes to determine the...Ch. 12.2 - Hydrology The following table shows the monthly...Ch. 12.2 - Prob. 8CECh. 12.2 - Automotive Trades The following table shows both...Ch. 12.2 - Hydrology The following table shows the daily...Ch. 12.2 - Allied Health The Apgar score is widely used to...Ch. 12.2 - Allied Health A pharmacist keeps careful track of...Ch. 12.2 - Prob. 13CECh. 12.2 - Prob. 14CECh. 12 - Read bar graphs, line graphs, and circle graphs....Ch. 12 - Prob. 2PCh. 12 - Prob. 3PCh. 12 - Prob. 4PCh. 12 - Graph I Electrical Trades In general, as amps...Ch. 12 - Graph I Electrical Trades What is the minimum size...Ch. 12 - Graph I Electrical Trades What is the minimum wire...Ch. 12 - Prob. 4APSCh. 12 - Prob. 5APSCh. 12 - Prob. 6APSCh. 12 - Prob. 7APSCh. 12 - Prob. 8APSCh. 12 - Prob. 9APSCh. 12 - Prob. 10APSCh. 12 - Prob. 11APSCh. 12 - Prob. 12APSCh. 12 - Prob. 13APSCh. 12 - Prob. 14APSCh. 12 - Prob. 15APSCh. 12 - Retail Merchandising A small computer store is...Ch. 12 - Retail Merchandising A small computer store is...Ch. 12 - Retail Merchandising A small computer store is...Ch. 12 - Retail Merchandising A small computer store is...Ch. 12 - In September, what was the ratio of computer...Ch. 12 - Retail Merchandising A small computer store is...Ch. 12 - Retail Merchandising A small computer store is...Ch. 12 - Retail Merchandising A small computer store is...Ch. 12 - Prob. 24APSCh. 12 - Prob. 25APSCh. 12 - Prob. 26APSCh. 12 - Prob. 27APSCh. 12 - Prob. 28APSCh. 12 - Prob. 29APSCh. 12 - Prob. 30APSCh. 12 - Graph V Business and Finance What was the actual...Ch. 12 - Graph V Business and Finance What was the...Ch. 12 - Graph V Business and Finance During which month...Ch. 12 - Graph V Business and Finance During which month...Ch. 12 - Graph V Business and Finance During which month...Ch. 12 - Graph V Business and Finance During which month...Ch. 12 - Graph V Business and Finance During which months...Ch. 12 - Graph V Business and Finance During which month...Ch. 12 - Graph VI Metalworking What percent of marine...Ch. 12 - Graph VI Metalworking What percent of this alloy...Ch. 12 - Graph VI Metalworking Without measuring, calculate...Ch. 12 - Graph VI Metalworking How many ounces of zinc are...Ch. 12 - Graph VI Metalworking How many grams of bismuth...Ch. 12 - Prob. 1BPSCh. 12 - Prob. 2BPSCh. 12 - Prob. 3BPSCh. 12 - Prob. 4BPSCh. 12 - Metalworking Construct a circle graph based on the...Ch. 12 - Fire Protection Construct a circle graph based on...Ch. 12 - Prob. 7BPSCh. 12 - C. Find the mean, median, and mode for each set of...Ch. 12 - C. Find the mean, median, and mode for each set of...Ch. 12 - C. Find the mean, median, and mode for each set of...Ch. 12 - C. Find the mean, median, and mode for each set of...Ch. 12 - Prob. 5CPSCh. 12 - C. Find the mean, median, and mode for each set of...Ch. 12 - Prob. 1DPSCh. 12 - Prob. 2DPSCh. 12 - Prob. 1EPSCh. 12 - Prob. 2EPSCh. 12 - Prob. 3EPSCh. 12 - Prob. 4EPSCh. 12 - Prob. 5EPSCh. 12 - Prob. 6EPSCh. 12 - Prob. 7EPSCh. 12 - Prob. 8EPS
Knowledge Booster


Learn more about
Need a deep-dive on the concept behind this application? Look no further. Learn more about this topic, subject and related others by exploring similar questions and additional content below.Similar questions
- DVD Player Sales The table shows the number of DVD players sold in a small electronics store in the years 2003-2013. Year DVD players sold 2003 495 2004 513 2005 410 2006 402 2007 520 2008 580 2009 631 2010 719 2011 624 2012 582 2013 635 aWhat was the average rate of change of sales between 2003 and 2013? bWhat was the average rate of change of sales between 2003 and 2004? cWhat was the average rate of change of sales between 2004 and 2005? dBetween which two successive years did DVD player sales increase most quickly? Decrease most quickly?arrow_forwardMathematical Models In Exercises 9 and 10, (a) plot the actual data and the model of the same graph and (b) describe how closely the model represents the data. If the model does not closely represent the data, suggest another type of model that may be a better fit. The ordered pairs below give the revenues y (in billions of dollars) for Activision Blizzard, Inc., from 2008 through 2014. 2008,3.032012,4.862009,4.282013,4.582010,4.452014,4.412011,4.76 A model for the data is y=0.184t+2.32,8t14, where t represents the year, with t=8 corresponding to 2008.arrow_forwardMathematical Models In Exercises 9 and 10, (a) plot the actual data and the model of the same graph and (b) describe how closely the model represents the data. If the model does not closely represent the data, suggest another type of model that may be a better fit. The ordered pairs below give the civilian non-institutional U.S. populations y (in millions of people) 16 years of age and over not in the civilian labor force from 2006 through 2014. 2006,77.42011,86.02007,78.72012,88.32008,79.52013,90.32009,81.72014,92.02010,83.9 A model for the data is y=1.92t+65.0,6t14, where t represents the years, with t=6 corresponding to 2006.arrow_forward
Recommended textbooks for you
 Big Ideas Math A Bridge To Success Algebra 1: Stu...AlgebraISBN:9781680331141Author:HOUGHTON MIFFLIN HARCOURTPublisher:Houghton Mifflin Harcourt
 Holt Mcdougal Larson Pre-algebra: Student Edition...AlgebraISBN:9780547587776Author:HOLT MCDOUGALPublisher:HOLT MCDOUGAL
 College AlgebraAlgebraISBN:9781305115545Author:James Stewart, Lothar Redlin, Saleem WatsonPublisher:Cengage Learning
 Algebra and Trigonometry (MindTap Course List)AlgebraISBN:9781305071742Author:James Stewart, Lothar Redlin, Saleem WatsonPublisher:Cengage Learning
 Algebra & Trigonometry with Analytic GeometryAlgebraISBN:9781133382119Author:SwokowskiPublisher:Cengage
 Glencoe Algebra 1, Student Edition, 9780079039897...AlgebraISBN:9780079039897Author:CarterPublisher:McGraw Hill
Big Ideas Math A Bridge To Success Algebra 1: Stu...
Algebra
ISBN:9781680331141
Author:HOUGHTON MIFFLIN HARCOURT
Publisher:Houghton Mifflin Harcourt
Holt Mcdougal Larson Pre-algebra: Student Edition...
Algebra
ISBN:9780547587776
Author:HOLT MCDOUGAL
Publisher:HOLT MCDOUGAL
College Algebra
Algebra
ISBN:9781305115545
Author:James Stewart, Lothar Redlin, Saleem Watson
Publisher:Cengage Learning
Algebra and Trigonometry (MindTap Course List)
Algebra
ISBN:9781305071742
Author:James Stewart, Lothar Redlin, Saleem Watson
Publisher:Cengage Learning
Algebra & Trigonometry with Analytic Geometry
Algebra
ISBN:9781133382119
Author:Swokowski
Publisher:Cengage
Glencoe Algebra 1, Student Edition, 9780079039897...
Algebra
ISBN:9780079039897
Author:Carter
Publisher:McGraw Hill
Correlation Vs Regression: Difference Between them with definition & Comparison Chart; Author: Key Differences;https://www.youtube.com/watch?v=Ou2QGSJVd0U;License: Standard YouTube License, CC-BY
Correlation and Regression: Concepts with Illustrative examples; Author: LEARN & APPLY : Lean and Six Sigma;https://www.youtube.com/watch?v=xTpHD5WLuoA;License: Standard YouTube License, CC-BY