
Videos
Supplier Quality: Three Inspection Outcomes. The Ertl Company is well known for its high-quality die-cast metal alloy toy replicas of tractors and other farm equipment. As part of a periodic procurement evaluation, Ertl is considering purchasing parts for a toy tractor line from three different suppliers. The parts received from the suppliers are classified as having a minor defect, having a major defect, or being good. Test results from samples of parts received from each of the three suppliers are shown below. Note that any test with these data is no longer a test of proportions for the three supplier populations because the categorical response variable has three outcomes: minor defect, major defect, and good.
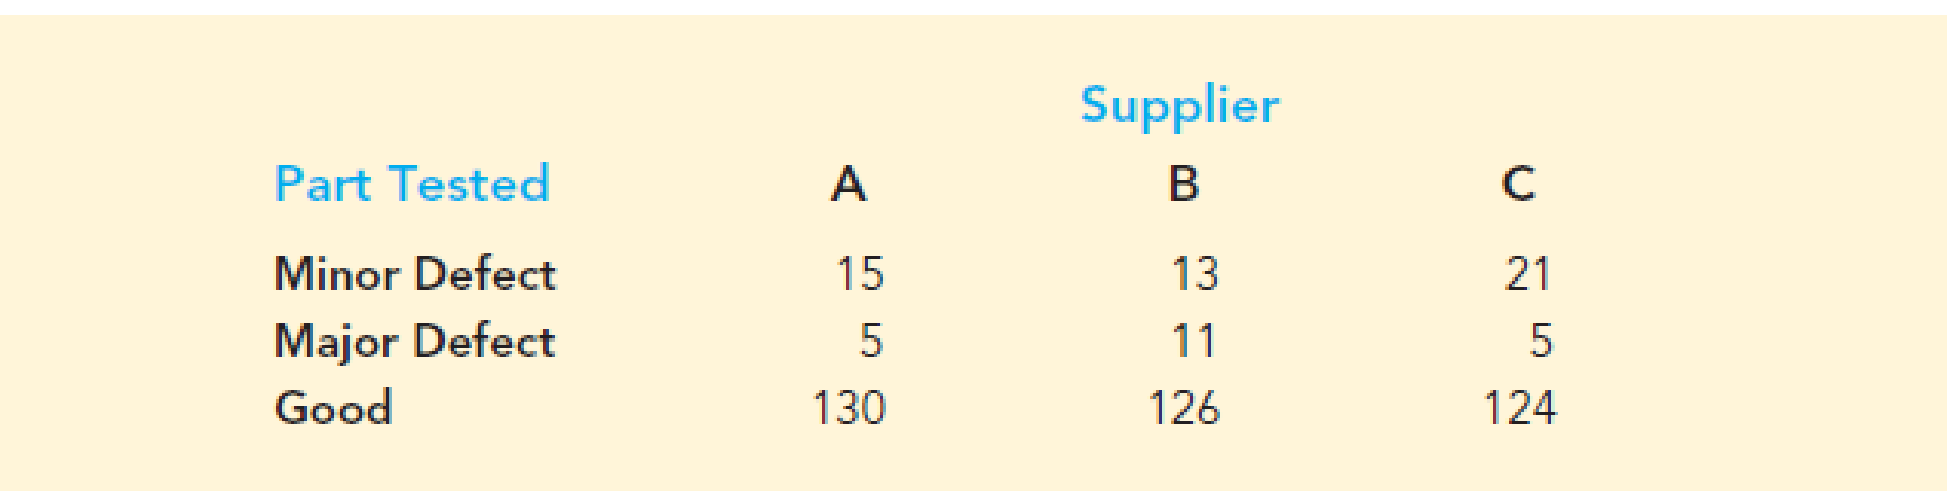
Using the data above, conduct a hypothesis test to determine if the distribution of defects is the same for the three suppliers. Use the chi-square test calculations as presented in this section with the exception that a table with r rows and c columns results in a chi-square test statistic with (r – 1)(c – 1) degrees of freedom. Using a .05 level of significance, what is the p-value and what is your conclusion?
Want to see the full answer?
Check out a sample textbook solution
Chapter 12 Solutions
Modern Business Statistics with Microsoft Office Excel (with XLSTAT Education Edition Printed Access Card) (MindTap Course List)


- In a study conduct by the Department of Mechanical Engineering at Virginia Tech, the steel rods supplied by two different companies were compared. Ten sample springs were made from the steel rods supplied by each company and a measure of flexibility was recorded for each. The data are as follows: Company A: 9.4 8.8 6.8 8.7 8.5 6.7 8.0 6.5 9.2 7.0 Company B: 9.6 11.0 9.8 9.9 10.2 10.1 9.7 11.0 11.1 10.2 Calculate the sample mean and median for the data for the two companies. Plot the data for the two companies and give impression on the data.arrow_forward6. In the book Business Research Methods (5th ed.), Donald R. Cooper and C. William Emory discuss studying the relationship between on-the-job accidents and smoking. Cooper and Emory describe the study as follows: Suppose a manager implementing a smoke-free workplace policy is interested in whether smoking affects worker accidents. Since the company has complete reports of on-the-job accidents, she draws a sample of names of workers who were involved in accidents during the last year. A similar sample from among workers who had no reported accidents in the last year is drawn. She interviews members of both groups to determine if they are smokers or not. The sample results are given in the following table.arrow_forwardA researcher plans to conduct a research study comparing two treatment conditions with a total of 20 scores in each treatment. Which of the following designs would require only 20 participants? a. independent-samples design b. matched-subjects design c. between-subjects design d. within-subjects designarrow_forward
- Is the crime rate in New York different from the crime rate in New Jersey? Independent random samples from region A (cities in New York) and region B (cities in New Jersey) gave the following information about violent crime rate (number of violent crimes per 100,000 population). (Reference: U.S. Department of Justice, Federal Bureau of Investigation.) Region A 436 408 539 489 439 600 402 595 422 434 486 Region B 438 435 428 556 534 470 616 401 478 430 379 415 Use a 10% level of significance to test the claim that there is no difference in the crime rate distributions of the two states. (a) What is the level of significance?State the null and alternate hypotheses. Ho: Distributions are different. H1: Distributions are the same.Ho: Distributions are the same. H1: Distributions are different. Ho: Distributions are the same. H1: Distributions are the same.Ho: Distributions are different. H1: Distributions are different. (b) Compute the sample test statistic. (Use 2 decimal…arrow_forwardIn order to estimate the relative abundance and geographic distribution of pheasants in Iowa, the Iowa Department of Natural Resources conducts annual road side surveys of pheasant populations. On the roads bordering five randomly selected farms in one county labeled generically as Farms A, B, C, D, and E, the survey counts were as follows: Farm # Pheasants Road miles A 3 1 B 8 1 C 9 2 D 5 1 E 11 3 One hypothesis about the geographic distribution of organisms, knowns as the spatial randomness hypothesis, asserts, as applied to the pheasant survey, that pheasants are randomly distributed throughout uniform habitat in such a way that the expected number of pheasants along any stretch of road is proportional to the length of that road. The lengths of road traveled along each farm are shown in the rightmost column of the table. Do the counts from the survey support or cast doubt on the spatial randomness hypothesis for pheasants on farmland in this country? Take a = 0.05.arrow_forwardA manufacturer is considering purchasing parts from three different suppliers. The parts received from the suppliers are classified as having a minor defect, having a major defect, or being good. Test results from samples of parts received from each of the three suppliers are shown below. Note that any test with these data is no longer a test of proportions for the three supplier populations because the categorical response variable has three outcomes: minor defect, major defect, and good.arrow_forward
- Is the crime rate in New York different from the crime rate in New Jersey? Independent random samples from region A (cities in New York) and region B (cities in New Jersey) gave the following information about violent crime rate (number of violent crimes per 100,000 population). (Reference: U.S. Department of Justice, Federal Bureau of Investigation.) Region A 467 454 409 607 562 503 602 516 610 590 453 Region B 406 569 517 408 532 465 501 457 443 617 613 524 Use a 10% level of significance to test the claim that there is no difference in the crime rate distributions of the two states. (a) What is the level of significance? (b) Compute the sample test statistic. (Use 2 decimal places.) (c) Find the P-value of the sample test statistic. (Use 4 decimal places.)arrow_forward1. An independent-measures study comparing two treatment conditions uses _____________ groups of participants and obtains _____________ score(s) for each participant. a. 1,1 b. 1,2 (incorrect answer) c. 2,1 d. 2,2arrow_forwardIn an agricultural experiment, the effects of two fertilizers on the production of oranges were measured. Fourteen randomly selected plots of land were treated with fertilizer A, and 10 randomly selected plots were treated with fertilizer B. The number of pounds of harvested fruit was measured from each plot. Following are the results. Fertilizer A 473 507 526 479 477 468 516 467 519 523 483 540 518 488Fertilizer B 455 501 470 420 483 419 468 476 459 513Assume that the populations are approximately normal. Construct a 95% confidence interval for the difference between the mean yields for the two types of fertilizer. Interpret the results.arrow_forward
- A report summarizes a survey of people in two independent random samples. One sample consisted of 700 young adults (aged 19 to 35) and the other sample consisted of 200 parents of children aged 19 to 35. The young adults were presented with a variety of situations (such as getting married or buying a house) and were asked if they thought that their parents were likely to provide financial support in that situation. The parents of young adults were presented with the same situations and asked if they would be likely to provide financial support to their child in that situation. 1. When asked about getting married, 41% of the young adults said they thought parents would provide financial support and 43% of the parents said they would provide support. Carry out a hypothesis test to determine if there is convincing evidence that the proportion of young adults who think parents would provide financial support and the proportion of parents who say they would provide support are different.…arrow_forwardA report summarizes a survey of people in two independent random samples. One sample consisted of 700 young adults (aged 19 to 35) and the other sample consisted of 200 parents of children aged 19 to 35. The young adults were presented with a variety of situations (such as getting married or buying a house) and were asked if they thought that their parents were likely to provide financial support in that situation. The parents of young adults were presented with the same situations and asked if they would be likely to provide financial support to their child in that situation. 1. The report stated that the proportion of young adults who thought parents would help with buying a house or apartment was 0.37. For the sample of parents, the proportion who said they would help with buying a house or an apartment was 0.27. Based on these data, can you conclude that the proportion of parents who say they would help with buying a house or an apartment is significantly less than the proportion…arrow_forwardThe Behavioral Risk Factor Surveillance System (BRFSS) is an annual telephone survey designed to identify risk factors in the adult population and reportemerging health trends. The following table summarizes two variables for the respondents: health status and health coverage, which describes whether each respondent had health insurance: Health Status Excellent Very Good Good Fair Poor Total Health No 459 727 854 385 99 2524 Coverage Yes 4198 6245 4821 1634 578 17476 Total 4657 6972 5675 2019 677 20000 If we draw one individual at random, what is the probability that the respondent has health coverage if they have good health? Answer with a decimal rounded to 3 decimal places.arrow_forward
 Glencoe Algebra 1, Student Edition, 9780079039897...AlgebraISBN:9780079039897Author:CarterPublisher:McGraw Hill