
(a)
To find:
The sum of squared errors, SSE.
Answer to Problem 9E
Solution:
The equation of the least squares regression line is
Squared error (SSE) is
Explanation of Solution
Given Information:
The numbers of parking tickets students received during one semester and their monthly
| Parking Tickets and Monthly Income | ||||||||||
| Number of Tickets, |
10 | 8 | 3 | 2 | 0 | 5 | 4 | 2 | 1 | 0 |
| Monthly Income (in Dollars), |
4000 | 3800 | 1500 | 2000 | 870 | 2500 | 1800 | 1200 | 1400 | |
The least Squares regression line is the line for which the average variation from the data is the smallest, also called the line of best fit, given by
Where ![]() is the slope of the least-squares regression line for paired data from a sample and
is the slope of the least-squares regression line for paired data from a sample and![]() is the
is the ![]() -intercept for the regression line.
-intercept for the regression line.
The sum of squared errors (SSE) for a regression line is the sum of the squares of the residuals.
Formula used:
The equation of least-squares regression line is given by
Where![]() , is the slope of the least-squares regression line given as,
, is the slope of the least-squares regression line given as,
![]() intercept given as,
intercept given as,
Here n is the number of data pairs in the sample, ![]() is the
is the ![]() value of the explanatory variable and
value of the explanatory variable and ![]() is the
is the ![]() value of response variable.
value of response variable.
The sum of squared errors (SSE) for a regression line is the sum of the squares of the residuals is given by,
Here ![]() is the
is the ![]() observed value of the response variable and
observed value of the response variable and ![]() is the predicted variable of
is the predicted variable of ![]() using the list square regression model.
using the list square regression model.
Calculation:
The table of the numbers of parking tickets students received during one semester and
their monthly Incomes is given by,
| Number of Tickets, |
Monthly Income (in Dollars), |
|||
| 10 | 4000 | 40000 | 100 | 16000000 |
| 8 | 3800 | 30400 | 64 | 14440000 |
| 3 | 1500 | 4500 | 9 | 2250000 |
| 2 | 2000 | 4000 | 4 | 4000000 |
| 0 | 870 | 0 | 0 | 756900 |
| 5 | 2500 | 12500 | 25 | 6250000 |
| 4 | 1800 | 7200 | 16 | 3240000 |
| 2 | 1000 | 2000 | 4 | 1000000 |
| 1 | 1200 | 1200 | 1 | 1440000 |
| 0 | 1400 | 0 | 0 | 1960000 |
Where,
Substitute 10 for![]() , 8 for
, 8 for![]() , 3 for
, 3 for![]() … 0 for
… 0 for ![]() in the above equation,
in the above equation,
Substitute ![]() for
for![]() ,
, ![]() for
for![]() ,
,![]() for
for![]() …
…![]() for
for ![]() in the above equation,
in the above equation,
In order to calculate the value of ![]() and 4000 for
and 4000 for ![]() in
in
Proceed in the same manner to calculate
In order to calculate the value of![]() , substitute 10 for
, substitute 10 for ![]() in
in![]() .
.
Proceed in the same manner to calculate![]() for the rest of the data and refer table for the rest of the
for the rest of the data and refer table for the rest of the ![]() values calculated.
values calculated.
In order to calculate the value of ![]() substitute 4000 for
substitute 4000 for ![]() in
in ![]() .
.
Proceed in the same manner to calculate![]() for the rest of the data and refer table for the rest of the
for the rest of the data and refer table for the rest of the ![]() values calculated.
values calculated.
The slope of the least-squares regression line is given as,
Substitute 35 for ![]() in the above equation of
in the above equation of![]() ,
,
The ![]() -intercept of regression line is given as,
-intercept of regression line is given as,
Substitute 35 for
The equation of least-squares regression line is,
The table of the numbers of parking tickets students received during one semester and
their monthly incomes is given by,
| Number of Tickets, |
Monthly Income (in Dollars), |
Predicted value, |
Residual, |
Squared error, |
| 10 | 4000 | 4047.87 | -47.87 | 2291.5369 |
| 8 | 3800 | 3419.91 | 380.09 | 144468.4081 |
| 3 | 1500 | 1850.01 | -350.01 | 122507.0001 |
| 2 | 2000 | 1536.03 | 463.97 | 215268.1609 |
| 0 | 870 | 908.07 | -38.07 | 1449.3249 |
| 5 | 2500 | 2477.97 | 22.03 | 485.3209 |
| 4 | 1800 | 2163.99 | -363.99 | 132488.7201 |
| 2 | 1000 | 1536.03 | -536.03 | 287328.1609 |
| 1 | 1200 | 1222.05 | -22.05 | 486.2025 |
| 0 | 1400 | 908.07 | 491.93 | 241995.1249 |
The predicted values ![]() are obtained by substituting the values of
are obtained by substituting the values of ![]() in the fitted regression line,
in the fitted regression line,
For![]() , substitute 10 for
, substitute 10 for ![]() in the above equation,
in the above equation,
Similarly the other values of ![]() are obtained and are shown in the third column of the table:
are obtained and are shown in the third column of the table:
The residuals ![]() and
and ![]() .
.
Substitute 4000 for ![]() and 4047.87 for
and 4047.87 for ![]() in above equation,
in above equation,
Similarly the other values of
The squared errors are obtained as,
Substitute ![]() for
for ![]() in
in
Thus,
Similarly the other values of
The sum of squared errors (SSE) for a regression line is,
From the above table SSE is given by,
Thus, the sum of squared error (SSE) is 114767.96.
Conclusion:
The equation of least-squares regression line is,
The sum of squared errors (SSE) is 1148767.96.
(b)
To find:
The Standard error of estimate, ![]() .
.
Answer to Problem 9E
Solution:
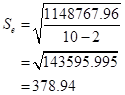
The Standard error of estimate ![]() is 378.94.
is 378.94.
Explanation of Solution
Given Information:
The numbers of parking tickets students received during one semester and their monthly
| Parking Tickets and Monthly Income | ||||||||||
| Number of Tickets, |
10 | 8 | 3 | 2 | 0 | 5 | 4 | 2 | 1 | 0 |
| Monthly Income (in Dollars), |
4000 | 3800 | 1500 | 2000 | 870 | 2500 | 1800 | 1000 | 1200 | 1400 |
Incomes is,
Formula used:
The standard error of estimate is a measure of the deviation of the sample data points from the regression line and is given by:
Here SSE is the sum of squared error and ![]() is the number of paired data set in the sample,
is the number of paired data set in the sample, ![]() is the
is the ![]() observed value of the response variable,
observed value of the response variable,
![]() is the predicted variable of
is the predicted variable of ![]() using the list square regression model.
using the list square regression model.
Calculation:
The formula of Standard error of estimate is,
From part a substitute ![]() for SSE and
for SSE and![]() for
for ![]() in the above equation of Standard error of estimate.
in the above equation of Standard error of estimate.
Conclusion:
Thus, the Standard error of estimate ![]() is 378.94.
is 378.94.
(c)
To Construct:
A 95% prediction interval for the given value of explanatory variable, ![]() .
.
Answer to Problem 9E
Solution:
The prediction interval is (2032.14, 3551.76).
Explanation of Solution
The prediction interval is a confidence interval for an individual value of the response
Variable y, at a given fixed value of the explanatory variable, x.
Formula used:
The formula to calculate the margin of error of a prediction interval for an individual value of the response variable, y, is given by,
n is the number of data pairs in the sample.
The formula to calculate the Prediction interval is given by,
or
Where
margin of error
The formula to calculate arithmetic mean is given by,
Where
Variables.
Calculation:
Arithmetic Mean is given as,
From part a substitute 10 for![]() , 10 for
, 10 for![]() , 8 for
, 8 for ![]() …..0 for
…..0 for ![]() in the above equation of arithmetic mean,
in the above equation of arithmetic mean,
Since the level of confidence is 95%,
Then using the t-distribution table, the critical value for this test
For ![]() -distribution with 8 degrees of freedom,
-distribution with 8 degrees of freedom,
The formula to calculate the margin of error of a prediction interval is,
Substitute 1.86 for![]() , 3.5 for
, 3.5 for![]() , 10 for
, 10 for![]() , 35 for
, 35 for![]() , 223 for
, 223 for![]() , 6 for
, 6 for ![]() and
and ![]() for
for ![]() in the above equation of margin of error,
in the above equation of margin of error,
Predicted value ![]() for
for ![]() is
is
![]()
The prediction interval is:
Substitute 2791.95for ![]() and 759.81 for
and 759.81 for ![]() in the above formula,
in the above formula,
The prediction interval is
Conclusion:
Thus, the prediction interval is
(d)
To Construct:
A 95% confidence interval for the ![]() intercept of regression line.
intercept of regression line.
Answer to Problem 9E
Solution:
The 95% confidence interval for the ![]() intercept
intercept ![]() is (496.45, 1319.69).
is (496.45, 1319.69).
Explanation of Solution
Given Information:
The numbers of parking tickets students received during one semester and their monthly
Incomes is,
| Parking Tickets and Monthly Income | ||||||||||
| Number of Tickets, x | 10 | 8 | 3 | 2 | 0 | 5 | 4 | 2 | 1 | 0 |
| Monthly Income | 4000 | 3800 | 1500 | 2000 | 870 | 2500 | 1800 | 1000 | 1200 | 1400 |
| (in Dollars), y | ||||||||||
Calculation:
To generate the regression table in excel follow the given steps:
1. Under data tab, choose data analytics and then select regression.
2. Select the input Y ![]() and select the input X range and enter the range of the given
and select the input X range and enter the range of the given ![]() data.
data.
3.Choose 95% confidence interval and click OK.
The following table will appear.
SUMMARY OUTPUT
| Regression Statistics | |||||
| Multiple R | 0.94662523 | ||||
| R Square | 0.89609937 | ||||
| Adjusted R Square | 0.88311172 | ||||
| Standard Error | 378.940622 | ||||
| Observations | 10 | ||||
ANOVA |
|||||
| df | SS | MS | F | Significance F | |
| Regression | 1 | 9907642.04 | 9907642 | 68.99665 | 3.32835E-05 |
| Residual | 8 | 1148767.96 | 143596 | ||
| Total | 9 | 11056410 | |||
| Coefficients | Standard Error | t Stat | P-value | Lower 95.0% | Upper 95.0% | |
| Intercept | 908.0696517 | 178.5009634 | 5.087197 | 0.000945 | 496.4456924 | 1319.69361 |
| X | 313.9800995 | 37.79968083 | 8.306422 | 3.33E-05 | 226.8138793 | 401.14632 |
From the above result,
1. Multiple R is the absolute value of the ![]() .
.
2.
3. Standard Error is the standard error of the estimate, ![]() .
.
4. The intersection of the Residual row and the SS column is the sum of squared errors, SSE.
5. The Lower 95.0% and the Upper 95.0% columns give the lower and upper endpoints of the 95% confidence intervals for the ![]() intercept and slope.
intercept and slope.
6. The coefficient columns gives the values for the coefficients, that is, the
![]() intercept and slope, of the regression line.
intercept and slope, of the regression line.
The row labeled Intercept is the row for the values corresponding to the ![]() intercept. The last two values in this row are the lower and upper endpoints for a 95% confidence for the
intercept. The last two values in this row are the lower and upper endpoints for a 95% confidence for the ![]() intercept of the regression line,
intercept of the regression line,
Thus, the 95% confidence interval for
Confidence Interval=(496.45, 1319.69).
Conclusion:
Thus, the 95% confidence interval for the ![]() intercept
intercept ![]() is(496.45, 1319.69).
is(496.45, 1319.69).
(e)
To Construct:
A 95% confidence interval for the slope of regression line.
Answer to Problem 9E
Solution:
Thus, the 95% confidence interval for the slope
Explanation of Solution
Given Information:
The numbers of parking tickets students received during one semester and their monthly
Incomes is,
| Parking Tickets and Monthly Income | ||||||||||
| Number of Tickets, x | 10 | 8 | 3 | 2 | 0 | 5 | 4 | 2 | 1 | 0 |
| Monthly Income | 4000 | 3800 | 1500 | 2000 | 870 | 2500 | 1800 | 1000 | 1200 | 1400 |
| (in Dollars), y | ||||||||||
Calculation:
To generate the regression table in excel follow the given steps:
1. Under data tab, choose data analytics and then select regression.
2. Select the input Y range and enter the range of the given ![]() and select the input X range and enter the range of the given
and select the input X range and enter the range of the given ![]() data.
data.
3.Choose 95% confidence interval and click OK.
The following table will appear.
SUMMARY OUTPUT
| Regression Statistics | ||||||
| Multiple R | 0.946625253 | |||||
| R Square | 0.89609937 | |||||
| Adjusted R Square | 0.883111792 | |||||
| Standard Error | 378.940622 | |||||
| Observations | 10 | |||||
| ANOVA | ||||||
| df | SS | MS | F | Significance F | ||
| Regression | 1 | 9907642.04 | 9907642 | 68.99665 | 3.32835E-05 | |
| Residual | 8 | 1148767.96 | 143596 | |||
| Total | 9 | 11056410 | ||||
| Coefficients | Standard Error | t Stat | P-value | Lower 95.0% | Upper 95.0% | |
| Intercept | 908.0696517 | 178.5009634 | 5.087197 | 0.000945 | 496.4456924 | 1319.69361 |
| X | 313.9800995 | 37.79968083 | 8.306422 | 3.33E-05 | 226.8138793 | 401.14632 |
From the above result,
1. Multiple R is the absolute value of the ![]() .
.
2.
3. Standard Error is the standard error of the estimate, ![]() .
.
4. The intersection of the Residual row and the SS column is the sum of squared errors, SSE.
5. The Lower 95.0% and the Upper 95.0% columns give the lower and upper endpoints of the 95% confidence intervals for the ![]() intercept and slope.
intercept and slope.
6. The coefficient columns gives the values for the coefficients, that is, the
![]() intercept and slope, of the regression line.
intercept and slope, of the regression line.
The row labeled ![]() is the row for the values corresponding to the slope of regression line. The last two values in this row are the lower and upper endpoints for a 95% confidence for the slope of the regression line,
is the row for the values corresponding to the slope of regression line. The last two values in this row are the lower and upper endpoints for a 95% confidence for the slope of the regression line,
Thus, the 95% confidence interval for
Confidence Interval=(226.81, 401.15).
Conclusion:
Thus, the 95% confidence interval for the slope ![]() is(226.81, 401.15).
is(226.81, 401.15).
Want to see more full solutions like this?
Chapter 12 Solutions
BEGINNING STATISTICS-CD (NEW ONLY)

 MATLAB: An Introduction with ApplicationsStatisticsISBN:9781119256830Author:Amos GilatPublisher:John Wiley & Sons Inc
 Probability and Statistics for Engineering and th...StatisticsISBN:9781305251809Author:Jay L. DevorePublisher:Cengage Learning
 Statistics for The Behavioral Sciences (MindTap C...StatisticsISBN:9781305504912Author:Frederick J Gravetter, Larry B. WallnauPublisher:Cengage Learning
 Elementary Statistics: Picturing the World (7th E...StatisticsISBN:9780134683416Author:Ron Larson, Betsy FarberPublisher:PEARSON
 The Basic Practice of StatisticsStatisticsISBN:9781319042578Author:David S. Moore, William I. Notz, Michael A. FlignerPublisher:W. H. Freeman
 Introduction to the Practice of StatisticsStatisticsISBN:9781319013387Author:David S. Moore, George P. McCabe, Bruce A. CraigPublisher:W. H. Freeman