Concept explainers
Videos
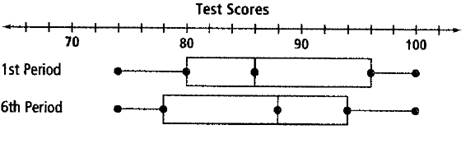
Use the box-and-whisker plot below. What does it tell you about the test scores in each class? Explain.
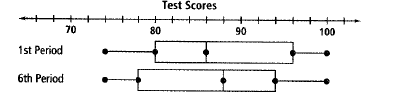
Use the box-and-whisker plot to tell about the test scores in each class.
Answer to Problem 13P
The median score of 6th period is more than that of the 1st period.
The overall distribution in both the periods is similar.
Explanation of Solution
Given:
Calculation:
In the box-and-whisker plot, the third line in the rectangle represents the median .
So, the median score of 6th period is more than that of the 1st period.
The overall distribution of test scores is similar in both the periods , since the minimum and maximum score is same for both periods.
Chapter 12 Solutions
High School Math 2012 Common-core Algebra 1 Practice And Problem Solvingworkbook Grade 8/9
Additional Math Textbook Solutions
Elementary Algebra: Concepts and Applications (10th Edition)
Elementary and Intermediate Algebra
Algebra and Trigonometry (6th Edition)
College Algebra (5th Edition)
College Algebra in Context with Applications for the Managerial, Life, and Social Sciences (5th Edition)
Algebra and Trigonometry


 Algebra and Trigonometry (6th Edition)AlgebraISBN:9780134463216Author:Robert F. BlitzerPublisher:PEARSON
 Contemporary Abstract AlgebraAlgebraISBN:9781305657960Author:Joseph GallianPublisher:Cengage Learning
 Linear Algebra: A Modern IntroductionAlgebraISBN:9781285463247Author:David PoolePublisher:Cengage Learning
 Algebra And Trigonometry (11th Edition)AlgebraISBN:9780135163078Author:Michael SullivanPublisher:PEARSON
 Introduction to Linear Algebra, Fifth EditionAlgebraISBN:9780980232776Author:Gilbert StrangPublisher:Wellesley-Cambridge Press
 College Algebra (Collegiate Math)AlgebraISBN:9780077836344Author:Julie Miller, Donna GerkenPublisher:McGraw-Hill Education