
Gen Combo Ll Applied Statistics In Business & Economics; Connect Access Card
6th Edition
ISBN: 9781260260632
Author: David Doane, Lori Seward Senior Instructor of Operations Management
Publisher: McGraw-Hill Education
expand_more
expand_more
format_list_bulleted
Concept explainers
Videos
Textbook Question
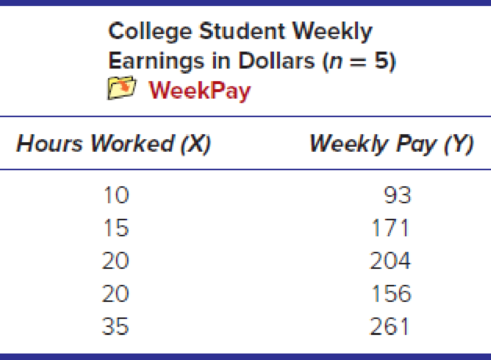
Chapter 12.4, Problem 18SE
Instructions for exercises 12.18 and 12.19: (a) Make an Excel worksheet to calculate SSxx, SSyy, and SSxy (the same worksheet you used in exercises 12.2 and 12.3). (b) Use the formulas to calculate the slope and intercept. (c) Use your estimated slope and intercept to make a worksheet to calculate SSE, SSR, and SST. (d) Use these sums to calculate the R2. (e) To check your answers, make an Excel
12.18
Expert Solution & Answer
Want to see the full answer?
Check out a sample textbook solution
Students have asked these similar questions
Prices of diamonds are determined by what is known as the 4 Cs: cut, clarity, color, and carat weight. The prices of diamonds go up as the carat weight increases, but the increase is not smooth. For example, the difference between the size of a 0.99-carat diamond and a 1-carat diamond is undetectable to the naked human eye, but the price of a 1-carat diamond tends to be much higher than the price of a 0.99 diamond. In this question, we use two random samples of diamonds, 0.99 carats and 1 carat, each sample of size 23, and compare the average prices of the diamonds. In order to be able to compare equivalent units, we first divide the price for each diamond by 100 times its weight in carats. That is, for a 0.99-carat diamond, we divide the price by 99. For a 1 carat diamond, we divide the price by 100. The distributions and some sample statistics are shown below
I have attached the questions and the chart in the images section. Thank you
A bank is quoting the following exchange rates AUD/USD = 0.71 25-35USD/CHF = 1.11 20-30 An Australian firm needs to sell Swiss francs. Calculate the cross-rate the bank will use. (X.XXXX)
The line graphs in Figure show the percentages of marriages ending in divorce based on the wife’s age at marriage.Here are two mathematical models that approximate the data displayed by the line graphs:In each model, the variable n is the number of years after marriage and the variable d is the percentage of marriages ending in divorce.a. Use the appropriate formula to determine the percentage of marriagesending in divorce after 10 years when the wife is over 25 at the time ofmarriage.b. Use the appropriate line graph in Figure to determine the percentageof marriages ending in divorce after 10 years when the wife is over 25 at the time of marriage.c. Does the value given by the mathematical model underestimate or overestimate the actual percentage of marriages ending in divorce after10 years as shown by the graph? By how much?
Chapter 12 Solutions
Gen Combo Ll Applied Statistics In Business & Economics; Connect Access Card
Ch. 12.1 - For each sample, do a test for zero correlation....Ch. 12.1 - Instructions for Exercises 12.2 and 12.3: (a) Make...Ch. 12.1 - Prob. 3SECh. 12.1 - Prob. 4SECh. 12.1 - Instructions for exercises 12.412.6: (a) Make a...Ch. 12.1 - Prob. 6SECh. 12.2 - (a) Interpret the slope of the fitted regression...Ch. 12.2 - (a) Interpret the slope of the fitted regression...Ch. 12.2 - Prob. 9SECh. 12.2 - (a) Interpret the slope of the fitted regression...
Ch. 12.2 - (a) Interpret the slope of the fitted regression...Ch. 12.3 - Prob. 12SECh. 12.3 - Prob. 13SECh. 12.3 - The regression equation Credits = 15.4 .07 Work...Ch. 12.3 - Below are fitted regressions for Y = asking price...Ch. 12.3 - Refer back to the regression equation in exercise...Ch. 12.3 - Refer back to the regression equation in exercise...Ch. 12.4 - Instructions for exercises 12.18 and 12.19: (a)...Ch. 12.4 - Instructions for exercises 12.18 and 12.19: (a)...Ch. 12.4 - Instructions for exercises 12.2012.22: (a) Use...Ch. 12.4 - Instructions for exercises 12.2012.22: (a) Use...Ch. 12.4 - Instructions for exercises 12.2012.22: (a) Use...Ch. 12.5 - Instructions for exercises 12.23 and 12.24: (a)...Ch. 12.5 - Instructions for exercises 12.23 and 12.24: (a)...Ch. 12.5 - A regression was performed using data on 32 NFL...Ch. 12.5 - A regression was performed using data on 16...Ch. 12.6 - Below is a regression using X = home price (000),...Ch. 12.6 - Below is a regression using X = average price, Y =...Ch. 12.6 - Instructions for exercises 12.2912.31: (a) Use...Ch. 12.6 - Instructions for exercises 12.2912.31: (a) Use...Ch. 12.6 - Instructions for exercises 12.2912.31: (a) Use...Ch. 12.7 - Refer to the Weekly Earnings data set below. (a)...Ch. 12.7 - Prob. 33SECh. 12.8 - Prob. 34SECh. 12.8 - Prob. 35SECh. 12.9 - Calculate the standardized residual ei and...Ch. 12.9 - Prob. 37SECh. 12.9 - An estimated regression for a random sample of...Ch. 12.9 - An estimated regression for a random sample of...Ch. 12.9 - Prob. 40SECh. 12.9 - Prob. 41SECh. 12.9 - Prob. 42SECh. 12.9 - Prob. 43SECh. 12.11 - Prob. 44SECh. 12.11 - Prob. 45SECh. 12 - (a) How does correlation analysis differ from...Ch. 12 - (a) What is a simple regression model? (b) State...Ch. 12 - (a) Explain how you fit a regression to an Excel...Ch. 12 - (a) Explain the logic of the ordinary least...Ch. 12 - (a) Why cant we use the sum of the residuals to...Ch. 12 - Prob. 6CRCh. 12 - Prob. 7CRCh. 12 - Prob. 8CRCh. 12 - Prob. 9CRCh. 12 - Prob. 10CRCh. 12 - Prob. 11CRCh. 12 - Prob. 12CRCh. 12 - (a) What is heteroscedasticity? Identify its two...Ch. 12 - (a) What is autocorrelation? Identify two main...Ch. 12 - Prob. 15CRCh. 12 - Prob. 16CRCh. 12 - (a) What is a log transform? (b) What are its...Ch. 12 - (a) When is logistic regression needed? (b) Why...Ch. 12 - Prob. 46CECh. 12 - Prob. 47CECh. 12 - Prob. 48CECh. 12 - Instructions: Choose one or more of the data sets...Ch. 12 - Prob. 50CECh. 12 - Prob. 51CECh. 12 - Prob. 52CECh. 12 - Prob. 53CECh. 12 - Instructions: Choose one or more of the data sets...Ch. 12 - Instructions: Choose one or more of the data sets...Ch. 12 - Instructions: Choose one or more of the data sets...Ch. 12 - Prob. 57CECh. 12 - Prob. 58CECh. 12 - Prob. 59CECh. 12 - Prob. 60CECh. 12 - Prob. 61CECh. 12 - Prob. 62CECh. 12 - Prob. 63CECh. 12 - Prob. 64CECh. 12 - Prob. 65CECh. 12 - In the following regression, X = weekly pay, Y =...Ch. 12 - Prob. 67CECh. 12 - In the following regression, X = total assets (...Ch. 12 - Prob. 69CECh. 12 - Below are percentages for annual sales growth and...Ch. 12 - Prob. 71CECh. 12 - Prob. 72CECh. 12 - Prob. 73CECh. 12 - Simple regression was employed to establish the...Ch. 12 - Prob. 75CECh. 12 - Prob. 76CECh. 12 - Prob. 77CECh. 12 - Below are revenue and profit (both in billions)...Ch. 12 - Below are fitted regressions based on used vehicle...Ch. 12 - Below are results of a regression of Y = average...Ch. 12 - Prob. 81CE
Knowledge Booster


Learn more about
Need a deep-dive on the concept behind this application? Look no further. Learn more about this topic, statistics and related others by exploring similar questions and additional content below.Similar questions
- Find the slpoe of the line: y=7arrow_forwardA $25,000 machine depreciates linearly to 0 over a 10 year period. What is the valye of the machine after 5 years? Select one: O 7500 O 17500 12500 10000 15000arrow_forwardGas mileage actually varies slightly with the driving speed of a car (as well as with highway vs. city driving). Suppose your car averages 29 miles per gallon on the highway if your average speed is 48 miles per hour, and it averages 26 miles per gallon on the highway if your average speed is 65 miles per hour. Answer parts (a) and (b) below. a. What is the driving time for a 2300-mile trip if you drive at an average speed of 48 miles per hour? What is the driving time at 65 miles per hour? The driving time at 48 miles per hour is hours. (Type an integer or decimal rounded to two decimal places as needed.) The driving time is at 65 miles per hour is (Round to two decimal places as needed.) b. Assume a gasoline price of $4.43 per gallon. What is the gasoline cost for a 2300-mile trip if you drive at an average speed of 48 miles per hour? What is the gasoline cost at 65 miles per hour? The gasoline cost at 48 miles per hour is $ (Round to two decimal places as needed.) hours. The…arrow_forward
- The table so the left side of data is cubic feet moved and right side is labor hoursarrow_forwardExplain the value of t?arrow_forwardA two-day environmental clean up started at 9AM on the first day. The number of workers fluctuated as shown in the figure. Suppose that the workers were paid 11 dollars per hour for work during the time period 9 am to 5 pm and were paid 16.5 dollars per hour for work during the rest of the day. What would the total personnel costs of the clean up have been under these conditions?total cost = ___________dollarsarrow_forward
arrow_back_ios
arrow_forward_ios
Recommended textbooks for you
 Algebra & Trigonometry with Analytic GeometryAlgebraISBN:9781133382119Author:SwokowskiPublisher:Cengage
 Trigonometry (MindTap Course List)TrigonometryISBN:9781337278461Author:Ron LarsonPublisher:Cengage Learning
 Linear Algebra: A Modern IntroductionAlgebraISBN:9781285463247Author:David PoolePublisher:Cengage Learning
 Algebra: Structure And Method, Book 1AlgebraISBN:9780395977224Author:Richard G. Brown, Mary P. Dolciani, Robert H. Sorgenfrey, William L. ColePublisher:McDougal Littell
 Big Ideas Math A Bridge To Success Algebra 1: Stu...AlgebraISBN:9781680331141Author:HOUGHTON MIFFLIN HARCOURTPublisher:Houghton Mifflin Harcourt
Algebra & Trigonometry with Analytic Geometry
Algebra
ISBN:9781133382119
Author:Swokowski
Publisher:Cengage
Trigonometry (MindTap Course List)
Trigonometry
ISBN:9781337278461
Author:Ron Larson
Publisher:Cengage Learning
Linear Algebra: A Modern Introduction
Algebra
ISBN:9781285463247
Author:David Poole
Publisher:Cengage Learning
Algebra: Structure And Method, Book 1
Algebra
ISBN:9780395977224
Author:Richard G. Brown, Mary P. Dolciani, Robert H. Sorgenfrey, William L. Cole
Publisher:McDougal Littell
Big Ideas Math A Bridge To Success Algebra 1: Stu...
Algebra
ISBN:9781680331141
Author:HOUGHTON MIFFLIN HARCOURT
Publisher:Houghton Mifflin Harcourt
What is a Linear Equation in One Variable?; Author: Don't Memorise;https://www.youtube.com/watch?v=lDOYdBgtnjY;License: Standard YouTube License, CC-BY
Linear Equation | Solving Linear Equations | What is Linear Equation in one variable ?; Author: Najam Academy;https://www.youtube.com/watch?v=tHm3X_Ta_iE;License: Standard YouTube License, CC-BY