
Gen Combo Ll Applied Statistics In Business & Economics; Connect Access Card
6th Edition
ISBN: 9781260260632
Author: David Doane, Lori Seward Senior Instructor of Operations Management
Publisher: McGraw-Hill Education
expand_more
expand_more
format_list_bulleted
Concept explainers
Videos
Textbook Question
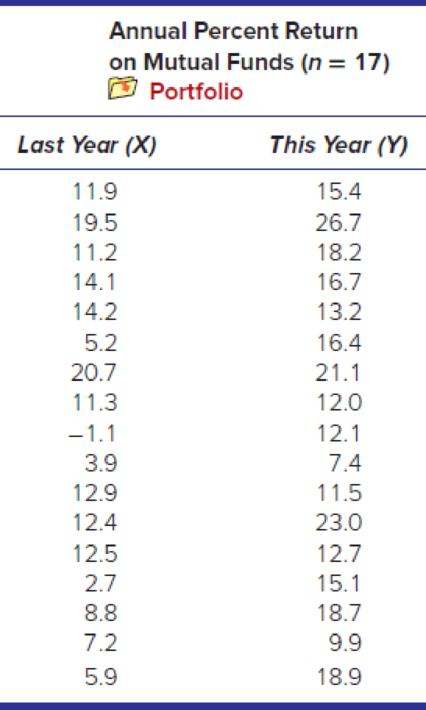
Chapter 12.4, Problem 21SE
Instructions for exercises 12.20–12.22: (a) Use Excel to make a
12.21
Expert Solution & Answer
Want to see the full answer?
Check out a sample textbook solution
Students have asked these similar questions
Exercises 83–86: The table lists data that are exactly linear.
a. Find the slope-intercept form of the line that passes through these
data points.
b. Predict y when x = -2.7 and 6.3. Decide if these calculations
involve interpolation or extrapolation.
-3
-2
-1
1
83.
y
-7.7
-6.2
-4.7
-3.2
-1.7
The data in the figure below represents the number of stars earned by 140 performers in a talent competition.How many performers earned exactly 0 stars? (be careful... the y-axis represents the PERCENTAGE of the total number of performers. Ex: 30% of 140 would = 140 * 0.30 = 42)
Part 3 of 5
(c) Use the data points (4, 1.4) and (28, 2.6) to find an equation of the line through these points. Express numbers as decimals or integers. Write the
answer in slope-intercept form (y=mx+b).
The equation is
0=0
Ś
X
Chapter 12 Solutions
Gen Combo Ll Applied Statistics In Business & Economics; Connect Access Card
Ch. 12.1 - For each sample, do a test for zero correlation....Ch. 12.1 - Instructions for Exercises 12.2 and 12.3: (a) Make...Ch. 12.1 - Prob. 3SECh. 12.1 - Prob. 4SECh. 12.1 - Instructions for exercises 12.412.6: (a) Make a...Ch. 12.1 - Prob. 6SECh. 12.2 - (a) Interpret the slope of the fitted regression...Ch. 12.2 - (a) Interpret the slope of the fitted regression...Ch. 12.2 - Prob. 9SECh. 12.2 - (a) Interpret the slope of the fitted regression...
Ch. 12.2 - (a) Interpret the slope of the fitted regression...Ch. 12.3 - Prob. 12SECh. 12.3 - Prob. 13SECh. 12.3 - The regression equation Credits = 15.4 .07 Work...Ch. 12.3 - Below are fitted regressions for Y = asking price...Ch. 12.3 - Refer back to the regression equation in exercise...Ch. 12.3 - Refer back to the regression equation in exercise...Ch. 12.4 - Instructions for exercises 12.18 and 12.19: (a)...Ch. 12.4 - Instructions for exercises 12.18 and 12.19: (a)...Ch. 12.4 - Instructions for exercises 12.2012.22: (a) Use...Ch. 12.4 - Instructions for exercises 12.2012.22: (a) Use...Ch. 12.4 - Instructions for exercises 12.2012.22: (a) Use...Ch. 12.5 - Instructions for exercises 12.23 and 12.24: (a)...Ch. 12.5 - Instructions for exercises 12.23 and 12.24: (a)...Ch. 12.5 - A regression was performed using data on 32 NFL...Ch. 12.5 - A regression was performed using data on 16...Ch. 12.6 - Below is a regression using X = home price (000),...Ch. 12.6 - Below is a regression using X = average price, Y =...Ch. 12.6 - Instructions for exercises 12.2912.31: (a) Use...Ch. 12.6 - Instructions for exercises 12.2912.31: (a) Use...Ch. 12.6 - Instructions for exercises 12.2912.31: (a) Use...Ch. 12.7 - Refer to the Weekly Earnings data set below. (a)...Ch. 12.7 - Prob. 33SECh. 12.8 - Prob. 34SECh. 12.8 - Prob. 35SECh. 12.9 - Calculate the standardized residual ei and...Ch. 12.9 - Prob. 37SECh. 12.9 - An estimated regression for a random sample of...Ch. 12.9 - An estimated regression for a random sample of...Ch. 12.9 - Prob. 40SECh. 12.9 - Prob. 41SECh. 12.9 - Prob. 42SECh. 12.9 - Prob. 43SECh. 12.11 - Prob. 44SECh. 12.11 - Prob. 45SECh. 12 - (a) How does correlation analysis differ from...Ch. 12 - (a) What is a simple regression model? (b) State...Ch. 12 - (a) Explain how you fit a regression to an Excel...Ch. 12 - (a) Explain the logic of the ordinary least...Ch. 12 - (a) Why cant we use the sum of the residuals to...Ch. 12 - Prob. 6CRCh. 12 - Prob. 7CRCh. 12 - Prob. 8CRCh. 12 - Prob. 9CRCh. 12 - Prob. 10CRCh. 12 - Prob. 11CRCh. 12 - Prob. 12CRCh. 12 - (a) What is heteroscedasticity? Identify its two...Ch. 12 - (a) What is autocorrelation? Identify two main...Ch. 12 - Prob. 15CRCh. 12 - Prob. 16CRCh. 12 - (a) What is a log transform? (b) What are its...Ch. 12 - (a) When is logistic regression needed? (b) Why...Ch. 12 - Prob. 46CECh. 12 - Prob. 47CECh. 12 - Prob. 48CECh. 12 - Instructions: Choose one or more of the data sets...Ch. 12 - Prob. 50CECh. 12 - Prob. 51CECh. 12 - Prob. 52CECh. 12 - Prob. 53CECh. 12 - Instructions: Choose one or more of the data sets...Ch. 12 - Instructions: Choose one or more of the data sets...Ch. 12 - Instructions: Choose one or more of the data sets...Ch. 12 - Prob. 57CECh. 12 - Prob. 58CECh. 12 - Prob. 59CECh. 12 - Prob. 60CECh. 12 - Prob. 61CECh. 12 - Prob. 62CECh. 12 - Prob. 63CECh. 12 - Prob. 64CECh. 12 - Prob. 65CECh. 12 - In the following regression, X = weekly pay, Y =...Ch. 12 - Prob. 67CECh. 12 - In the following regression, X = total assets (...Ch. 12 - Prob. 69CECh. 12 - Below are percentages for annual sales growth and...Ch. 12 - Prob. 71CECh. 12 - Prob. 72CECh. 12 - Prob. 73CECh. 12 - Simple regression was employed to establish the...Ch. 12 - Prob. 75CECh. 12 - Prob. 76CECh. 12 - Prob. 77CECh. 12 - Below are revenue and profit (both in billions)...Ch. 12 - Below are fitted regressions based on used vehicle...Ch. 12 - Below are results of a regression of Y = average...Ch. 12 - Prob. 81CE
Knowledge Booster


Learn more about
Need a deep-dive on the concept behind this application? Look no further. Learn more about this topic, statistics and related others by exploring similar questions and additional content below.Similar questions
- Rick is a school principal, and he is trying to decide if there is a relationship between conduct infractions and the number of students present at school during the day when infractions occur. How should he set up a scatterplot to help him see if there is a relationship? O plot the number of infractions on the y-axis and the number of students present on the x-axis O plot the number of infractions on the y-axis and the day of the week on the x-axis O plot the number of infractions on the x-axis and the number of students present on the y-axis O plot the number of infractions on the x-axis and the day of the week on the y-axisarrow_forward(b) Plot the following ordered pairs on a recta (1,-12.2),(2,-4.4),(3,9.4) (4,28.1),(5,49.8),(6,58.3) (7,62.2),(8,57.4),(9,45.7) (10,23.1),(11,5.4),(12,-11.7)arrow_forwardPercentage of young adults using social networkingsites. In 2006, the percentage of 18- to 29-year-oldswho used social networking sites was 49%. In 2013, thatpercentage had risen to 89%. (Source: pewresearch.org.)a) Use the year as the x-coordinate and the percentageas the y-coordinate. Find the equation of the line thatcontains the data points.b) Use the equation in part (a) to estimate thepercentage of young adults using social networkingsites in 2014.c) Use the equation in part (a) to estimate the year inwhich the percentage of young adults using socialnetworking sites will reach 100%.d) Explain why a linear equation cannot be used foryears after the year found in part (c).arrow_forward
- Assume that the data can be modeled by a straight line and that the trend continues indefinitely. Use two data points to find such a line and then answer the question. Suppose a baseball is thrown at 82 miles per hour. The ball will travel 296 feet when hit by a bat swung at 52 miles per hour and will travel 392 feet when hit by a bat swung at 84 miles per hour. Let y be the number of feet traveled by the ball when hit by a bat swung at x miles per hour. How much farther will a ball travel for each mile-per-hour increase in the speed of the bat? A ball will travel feet farther for each mile-per-hour increase in the speed of the bat. (Type a whole number.)arrow_forwardThe earnings per share for a social media company were $5.19 in 2017 and $7.53 in 2018. Use the midpoint formula to estimate the earnings (in dollars) per share in 2019. Assume that the earnings per share followed a linear pattern. $_______ per sharwarrow_forwardWhat is the mode of the data represented in the dot plot?arrow_forward
- 4. The scatter plot shows the number of hits and home runs for 20 baseball players who had at least 10 hits last season. The table below shows the values for 15 of those players. The model, represented by y = 0.15x – 1.5, is graphed with a scatter plot. 30 10 of 100 hits 150 200 Use the graph and the table to answer the questions. a. Player A had 154 hits in 2015. How many home runs did he have? How many was he predicted to have? b. Player How many hits did Player B have last season? c. What would you expect to see in the graph for a player who hit many fewer home runs than the model predicted? was the player who most outperformed the prediction. hits home runs predicted home runs 12 2 0.3 22 1 1.8 154 26 21.6 145 11 110 16 20.3 15 57 3 7.1 20.9 149 17 29 2 2.9 13 1 0.5 18 1 1.2 86 15 163 31 11.4 23 115 13 15.8 57 96 16 7.1 W og e w 8.1 10 12.9 home runsarrow_forwardDorothy's mother has been measuring her height each birthday since she was born. The relationship between Dorothy's age and her height is shown below. Dorothy wants to make a scatter plot showing how her height has changed over time. 16 Complete the sentences below: Darcy's age should go on the axis. The range of the axis should be from to Age (years) Height (inches) 1 17 28 3 30 33 5. 37 6. 40 7 41 43 6. 45 10 47 11 51 12 52 SHOW HINT 4.arrow_forwardA survey was distributed to a group of people asking them how many times they had ordered takeout in the past week. They were also asked how much money they saved that week. The scatter plot displays the relationship between the data collected. the trend line goes through the points (1,230) and (3,190). What is the equation of the trend line. The equation should be in slope form. interpret the slope and y intercept in this context. predict the amount of money a person save when they order takeout 9 times.arrow_forward
- Interpret the unstandardized coefficient for highest years of schooling. E.g., Is the relationship positive or negative? How does a one-unit change in schooling (i.e. an increase in one-year of education) influence Y? Interpret the constant (i.e. the intercept) in the equation? What does it indicate? Calculate the average number of hours watched for someone with 12 years of education.arrow_forwardPlease help me answer d e and farrow_forwardDetermine the equation of a straight line that fits to the data points (1, 4), (2, 6), (3, 9), (4, 11), (5, 14), (6, 16). Round-off your answer to 2 decimal places. need asaparrow_forward
arrow_back_ios
SEE MORE QUESTIONS
arrow_forward_ios
Recommended textbooks for you
 Glencoe Algebra 1, Student Edition, 9780079039897...AlgebraISBN:9780079039897Author:CarterPublisher:McGraw Hill
Glencoe Algebra 1, Student Edition, 9780079039897...
Algebra
ISBN:9780079039897
Author:Carter
Publisher:McGraw Hill
Correlation Vs Regression: Difference Between them with definition & Comparison Chart; Author: Key Differences;https://www.youtube.com/watch?v=Ou2QGSJVd0U;License: Standard YouTube License, CC-BY
Correlation and Regression: Concepts with Illustrative examples; Author: LEARN & APPLY : Lean and Six Sigma;https://www.youtube.com/watch?v=xTpHD5WLuoA;License: Standard YouTube License, CC-BY