
Videos
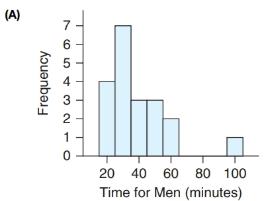
Morning Routine A statistics student conducted a survey to determine how much time students at her school spent getting ready to leave the house after they got up in the morning. Figure A shows a histogram of the times for men. Assume that we have a random sample of 20 college men.
a. Figure B shows a 95% confidence interval for the
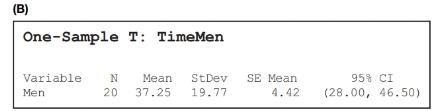
b. After a log transform of the times is taken, a histogram of the log of the data suggests that the distribution of the transformed data is Normal. Figure C shows a 95% confidence interval for the log (base 10) of the times. Convert the boundaries back into minutes by raising 10 to the powers given as the end points of the confidence interval. Interpret the confidence interval for the geometric mean.
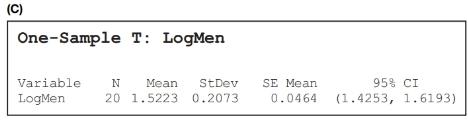
c. Which interval is narrower?
d. Which interval would you report if the goal was to understand the typical amount of time spent getting ready in the morning for men at this college? Explain.
Want to see the full answer?
Check out a sample textbook solution
Chapter 13 Solutions
Introductory Statistics
Additional Math Textbook Solutions
Essentials of Statistics (6th Edition)
APPLIED STAT.IN BUS.+ECONOMICS
Statistics for Engineers and Scientists
Elementary Statistics Using The Ti-83/84 Plus Calculator, Books A La Carte Edition (5th Edition)
Intro Stats, Books a la Carte Edition (5th Edition)
Statistics Through Applications


- Cable TV The following table shows the number C. in millions, of basic subscribers to cable TV in the indicated year These data are from the Statistical Abstract of the United States. Year 1975 1980 1985 1990 1995 2000 C 9.8 17.5 35.4 50.5 60.6 60.6 a. Use regression to find a logistic model for these data. b. By what annual percentage would you expect the number of cable subscribers to grow in the absence of limiting factors? c. The estimated number of subscribers in 2005 was 65.3million. What light does this shed on the model you found in part a?arrow_forwardWorld Population The following table shows world population N, in billions, in the given year. Year 1950 1960 1970 1980 1990 2000 2010 N 2.56 3.04 3.71 4.45 5.29 6.09 6.85 a. Use regression to find a logistic model for world population. b. What r value do these data yield for humans on planet Earth? c. According to the logistic model using these data, what is the carrying capacity of planet Earth for humans? d. According to this model, when will world population reach 90 of carrying capacity? Round to the nearest year. Note: This represents a rather naive analysis of world population.arrow_forwardTable 6 shows the population, in thousands, of harbor seals in the Wadden Sea over the years 1997 to 2012. a. Let x represent time in years starting with x=0 for the year 1997. Let y represent the number of seals in thousands. Use logistic regression to fit a model to these data. b. Use the model to predict the seal population for the year 2020. c. To the nearest whole number, what is the limiting value of this model?arrow_forward
- What situations are best modeled by a logistic equation? Give an example, and state a case for why the example is a good fit.arrow_forwardSales of a video game released in the year 2000 took off at first, but then steadily slowed as time moved on. Table 4 shows the number of games sold, in thousands, from the years 20002010. a. Let x represent time in years starting with x=1 for the year 2000. Let y represent the number of games sold in thousands. Use logarithmic regression to fit a model to these data. b. If games continue to sell at this rate, how many games will sell in 2015? Round to the nearest thousand.arrow_forwardSpecial Rounding Instructions For this exercise set, round all regression parameters to three decimal places, but round all other answers to two decimal places unless otherwise indicated. First Down The following table shows the probability P, as a percentage, of a college football team converting on fourth down when not goal to go versus the distance D, in yards, to the first down maker. 28 D = distance, in yards P = probability 1 70 2 60 3 53 4 46 5 41 6 37 7 34 8 32 a.Use exponential regression to model the data. b.Plot the data along with the exponential model. c.What probability does the model give of gaining a first down for fourth down and 10yards to go? Note: the actual probability is 28.arrow_forward
- What does the y -intercept on the graph of a logistic equation correspond to for a population modeled by that equation?arrow_forwardRepeat Example 5 when microphone A receives the sound 4 seconds before microphone B.arrow_forwardOlympic Pole Vault The graph in Figure 7 indicates that in recent years the winning Olympic men’s pole vault height has fallen below the value predicted by the regression line in Example 2. This might have occurred because when the pole vault was a new event there was much room for improvement in vaulters’ performances, whereas now even the best training can produce only incremental advances. Let’s see whether concentrating on more recent results gives a better predictor of future records. (a) Use the data in Table 2 (page 176) to complete the table of winning pole vault heights shown in the margin. (Note that we are using x=0 to correspond to the year 1972, where this restricted data set begins.) (b) Find the regression line for the data in part ‚(a). (c) Plot the data and the regression line on the same axes. Does the regression line seem to provide a good model for the data? (d) What does the regression line predict as the winning pole vault height for the 2012 Olympics? Compare this predicted value to the actual 2012 winning height of 5.97 m, as described on page 177. Has this new regression line provided a better prediction than the line in Example 2?arrow_forward
 Functions and Change: A Modeling Approach to Coll...AlgebraISBN:9781337111348Author:Bruce Crauder, Benny Evans, Alan NoellPublisher:Cengage Learning
 College AlgebraAlgebraISBN:9781305115545Author:James Stewart, Lothar Redlin, Saleem WatsonPublisher:Cengage Learning
 Algebra & Trigonometry with Analytic GeometryAlgebraISBN:9781133382119Author:SwokowskiPublisher:Cengage
 Glencoe Algebra 1, Student Edition, 9780079039897...AlgebraISBN:9780079039897Author:CarterPublisher:McGraw Hill
 Trigonometry (MindTap Course List)TrigonometryISBN:9781337278461Author:Ron LarsonPublisher:Cengage Learning