
Videos
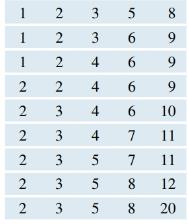
Exercise Hours A statistics student was interested in the amount of time that community college students exercise each week. He gathered data from a random sample of students at his com-munity college and excluded those who did not exercise (those who reported 0 hours per week); this left 45 in the sample. All values were rounded to the nearest hour.
The table shows the data. Figure A shows a histogram of the data, and Figure B shows a histogram of the log transform (base 10) of the data.
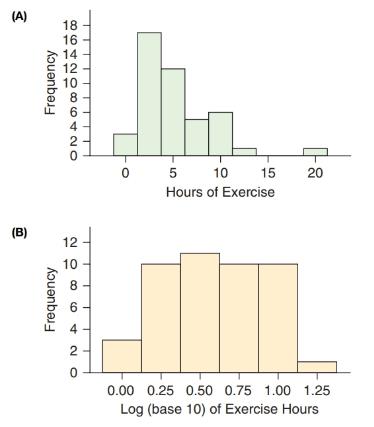
a. Describe the distribution of the untransformed sample.
b. Find a 95% confidence interval for the
c. Describe the distribution of the transformed data, and compare it with the distribution of the original data in part a.
d. Perform a log transform on the observations. Find the boundaries for a 95% confidence interval for the mean of the log-transformed times.
e. Convert the log interval boundaries back to units of hours. Interpret the resulting interval.
f. Which interval would you report: the interval for the population mean or the interval for the population geometric mean? Explain.
Want to see the full answer?
Check out a sample textbook solution
Chapter 13 Solutions
Introductory Statistics
Additional Math Textbook Solutions
Basic Business Statistics, Student Value Edition
Elementary Statistics: Picturing the World (7th Edition)
Elementary Statistics Using The Ti-83/84 Plus Calculator, Books A La Carte Edition (5th Edition)
Statistics Through Applications
Statistics for Business & Economics, Revised (MindTap Course List)
Elementary Statistics ( 3rd International Edition ) Isbn:9781260092561


 Algebra & Trigonometry with Analytic GeometryAlgebraISBN:9781133382119Author:SwokowskiPublisher:Cengage