Statistics for Engineers and Scientists
4th Edition
ISBN: 9780073530789
Author: Navidi
Publisher: MCG
expand_more
expand_more
format_list_bulleted
Concept explainers
Videos
Textbook Question
Chapter 1.3, Problem 14E
Following are boxplots comparing the amount of econozole nitrate (in µg/cm2) absorbed into skin for a brand name and a generic antifungal ointment (from the article "Improved Bioequivalence Assessment of Topical Dermatological Drug Products Using Dermatopharmacokinetics.” B. N’Dri-Stempfer, W. Navidi, R. Guy, and A. Bunge, Pharmaceutical Research, 2009:316–328).
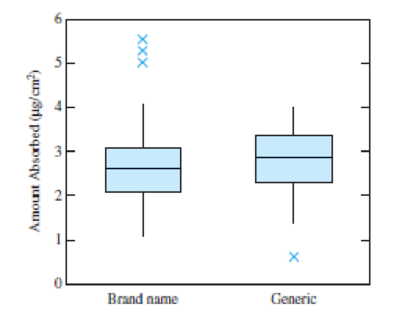
True or false:
- a. The median amount absorbed for the brand name drug is greater than the 25th percentile of the amount absorbed for the generic drug.
- b. The median amount absorbed for the brand name drug is greater than the median amount absorbed for the generic drug.
- c. About half the sample values for the brand name drug are between 2 and 3.
- d. There is a greater proportion of values outside the box for the brand name drug than for the generic drug.
- e. Both samples are skewed to the right.
- f. Both samples contain outliers.
Expert Solution & Answer
Want to see the full answer?
Check out a sample textbook solution
Students have asked these similar questions
In order to determine whether there are significant differences in the durability of three makes of computers, samples of size n=5 are selected from each make and the frequency of repair during the first year of purchase is observed. The results are as given in the adjoining table. In view of the data, what conclusions can you draw?
The following shows AIDS patients who are exposed and not exposed to IV drug use and mortality after a follow-up of certain years.
Exposed subjects (n = 300):
Person-years observation = 6000 and deaths = 30
Unexposed subjects (n = 400):
Person-years observation = 6000 and deaths = 10
Calculate and interpret the following:
Cumulative incidence rate for each group
Incidence rate for each group (incidence density)
Risk ratio and Risk difference
A paper gave summary quantities for blood lead level (in micrograms per deciliter) for a sample of whites and a sample of African Americans. Data consistent with the given summary quantities is given below.
Whites (W)
8.3
0.9
2.9
5.6
5.8
5.4
1.2
1.0
1.4
2.1
1.3
5.3
8.4
6.6
5.2
3.4
2.9
2.7
6.7
3.6
African Americans (AA)
4.8
1.4
0.9
10.8
2.4
0.6
5.0
5.4
6.1
2.9
5.0
2.1
7.5
3.4
13.6
1.4
3.7
3.3
14.8
3.9
(a)
Calculate the values of the mean and the median for blood lead level for the sample of African Americans.
mean
median
(b)
Which of the mean or the median is larger? What characteristic of the data set explains the relative values of the mean and the median?
The median is greater than the mean. This is explained by the fact that the distribution is positively skewed.
The mean is greater than the median. This is explained by the fact that the distribution is positively skewed.
The median is greater than the mean. This is explained by the fact that the…
Chapter 1 Solutions
Statistics for Engineers and Scientists
Ch. 1.1 - Each of the following processes involves sampling...Ch. 1.1 - If you wanted to estimate the mean height of all...Ch. 1.1 - True or false: a. A simple random sample is...Ch. 1.1 - A sample of 100 college students is selected from...Ch. 1.1 - A certain process for manufacturing integrated...Ch. 1.1 - Refer to Exercise 5. True or false: a. If the...Ch. 1.1 - To determine whether a sample should be treated as...Ch. 1.1 - A medical researcher wants to determine whether...Ch. 1.1 - A medical researcher wants to determine whether...Ch. 1.2 - True or false: For any list of numbers, half of...
Ch. 1.2 - Is the sample mean always the most frequently...Ch. 1.2 - Is the sample mean always equal to one of the...Ch. 1.2 - Is the sample median always equal to one of the...Ch. 1.2 - Find a sample size for which the median will...Ch. 1.2 - For a list of positive numbers, is it possible for...Ch. 1.2 - Is it possible for the standard deviation of a...Ch. 1.2 - In a certain company, every worker received a...Ch. 1.2 - In another company, every worker received a 5%...Ch. 1.2 - A sample of 100 adult women was taken, and each...Ch. 1.2 - In a sample of 20 men, the mean height was 178 cm....Ch. 1.2 - Each of 16 students measured the circumference of...Ch. 1.2 - Refer to Exercise 12. a. If the measurements for...Ch. 1.2 - There are 10 employees in a particular division of...Ch. 1.2 - Quartiles divide a sample into four nearly equal...Ch. 1.2 - In each of the following data sets, tell whether...Ch. 1.3 - The weather in Los Angeles is dry most of the...Ch. 1.3 - Forty-five specimens of a certain type of powder...Ch. 1.3 - Refer to Table 1.2 (in Section 1.2). Construct a...Ch. 1.3 - Following are measurements of soil concentrations...Ch. 1.3 - A certain reaction was run several times using...Ch. 1.3 - Sketch a histogram for which a. The mean is...Ch. 1.3 - The figure below is a histogram showing the...Ch. 1.3 - The histogram below presents the compressive...Ch. 1.3 - Refer to Table 1.4 (in Section 1.3). a. Using the...Ch. 1.3 - Refer to Table 1.5 (in Section 1.3). a. Using the...Ch. 1.3 - The following table presents the number of...Ch. 1.3 - Which of the following statistics cannot be...Ch. 1.3 - A sample of 100 resistors has an average...Ch. 1.3 - Following are boxplots comparing the amount of...Ch. 1.3 - Following are summary statistics for two data...Ch. 1.3 - Match each histogram to the box plot that...Ch. 1.3 - Prob. 17ECh. 1.3 - Match each scatterplot to the statement that best...Ch. 1.3 - Prob. 19ECh. 1 - A vendor converts the weights on the packages she...Ch. 1 - Refer to Exercise 1. The vendor begins using...Ch. 1 - The specification for the pull strength of a wire...Ch. 1 - A coin is tossed twice and comes up heads both...Ch. 1 - The smallest number on a list is changed from 12.9...Ch. 1 - There are 15 numbers on a list, and the smallest...Ch. 1 - There are 15 numbers on a list, and the mean is...Ch. 1 - The article The Selection of Yeast Strains for the...Ch. 1 - Concerning the data represented in the following...Ch. 1 - True or false: In any boxplot, a. The length of...Ch. 1 - For each of the following histograms, determine...Ch. 1 - In the article Occurrence and Distribution of...Ch. 1 - The article Vehicle-Arrival Characteristics at...Ch. 1 - The cumulative frequency and the cumulative...Ch. 1 - The article Hydrogeochemical Characteristics of...Ch. 1 - Water scarcity has traditionally been a major...Ch. 1 - Prob. 18SECh. 1 - The article The Ball-on-Three-Ball Test for...
Knowledge Booster


Learn more about
Need a deep-dive on the concept behind this application? Look no further. Learn more about this topic, statistics and related others by exploring similar questions and additional content below.Similar questions
- A paper gave summary quantities for blood lead level (in micrograms per deciliter) for a sample of whites and a sample of African Americans. Data consistent with the given summary quantities is given below. Whites (W) 8.3 0.9 2.9 5.6 5.8 5.4 1.2 1.0 1.4 2.1 1.3 5.3 8.4 6.6 5.2 3.6 2.9 2.7 6.7 3.8 African Americans (AA) 4.8 1.4 0.9 10.8 2.4 0.6 5.0 5.4 6.1 2.9 5.0 2.1 7.5 3.4 13.4 1.4 3.9 3.3 14.8 4.1 (a) Calculate the values of the mean and the median for blood lead level for the sample of African Americans. meanmedian (b) Which of the mean or the median is larger? What characteristic of the data set explains the relative values of the mean and the median? The mean is greater than the median. This is explained by the fact that the distribution is positively skewed.The median is greater than the mean. This is explained by the fact that the distribution is positively skewed. The median is greater than the mean. This is explained by the fact that the…arrow_forwardTwo rival manufacturers of penlight batteries claimed that their product lasts longer than the other. Thirty samples of Brand A and thirty-four of Brand B were tested. The following are the lengths of lives of such batteries recorded in hours. Use . Brand A384142363941433536384239404344 354039374042443837414038424541 Brand B3840414339414043393840434439404142 3940454038424140363741424036384140 A teacher wants to find out if there is a significant difference in the academic performance of two groups of students. One group meets thrice a week while the other meets twice a week. Below are the final exam scores of the two groups. Use . 3x/wk8085747565668077759566557985 2x/wk669887848556592553456652arrow_forward. A professor at the University of Iowa was interested in evaluating whether domestic dispute calls were more dangerous to officers than other types of calls. Collecting information on call for service and whether the call resulted in officer injury. The data is displayed in the contingency table below. Type of Call Domestic Dispute Not a Domestic Dispute Officer Injury No 128 675 Yes 245 786 Using the information to complete Table 1 and answer the questions below. Table 1. Chi-square Category Observed Expected O – E (O – E)2 (O – E)2/E No, Domestic 128 163.31 -35.31 1246..796 7.64 No, Not Domestic 675 639.69 35.31 1246.796 1.95 Yes, Domestic 245 209.69 35.31 11506.85 5.951.52 Yes, Not Domestic 786 821.31 -35.31 1246.796 Using an alpha level of 0.05, are domestic calls more dangerous for officers than other types of calls? Compute…arrow_forward
- In each of the following situations, identify the scale(s) ofmeasurement that is appropriate for each situation. (i) A visiting school inspector asked a class teacher to rank thethirty students in her class on “level of discipline”, with 1 standingfor the least disciplined student and 30 standing for the most 3 disciplined student.(ii) Identical twins living in different environments are beingcompared to find out the influence of the environment on theiracademic performance. A standard test on academic performance isgiving to fifty (50) sets of identical twins and their performancegraded over 100. (iii) “Regular” students and students admitted under thedistance learning programme into Accra Institute ofTechnology are administrated a questionnairemeasuring “level of maturity” of the students, withscores on “level of maturity” ranging from 0 to 10. (iv) One thousand students in a statistics class are asked torate their lecturer on teaching effectiveness at the end ofthe…arrow_forwardPlease answer the following: Thank you. A study was conducted on levels of PBC in soil samples in both rural and urban areas with the following results in PPM units: Rural: 3.5 1.0 1.6. 12.0 8.1 5.3 23.0 8.2 1.8 9.8 1.5 9.7 9.0 Urban: 24.0 11.0 107.0 18.0 29.0 49.0 94.0 12.0 16.0 22.0 141.0 18.0 21.0 13.0 11.0. Construct two boxplots, one for rural and one for urban. Write a paragraph comparing the two distributions.arrow_forwardIn a population-based cohort study, an entire community was interviewed regarding smoking habits and then followed for one year. Upon ascertainment of all lung cancer deaths, the investigator obtained the following data: Number of Individuals Lung Cancer Deaths Smokers 24,500 15 Nonsmokers 10,500 2 Calculate the risk difference per 100,000 per year. Round to the tenth decimaarrow_forward
- In an SPSS analysis between Race and Prestige, which one would be the IV and which one would be the DV?arrow_forwardA study of college students in the city of Pemblington found that 8% had been victims of violent crimes. a) statistics b) parameterarrow_forward. A professor at the University of Iowa was interested in evaluating whether domestic dispute calls were more dangerous to officers than other types of calls. Collecting information on call for service and whether the call resulted in officer injury. The data is displayed in the contingency table below. Type of Call Domestic Dispute Not a Domestic Dispute Officer Injury No 128 675 Yes 245 786 Using the information to complete Table 1 and answer the questions below. Table 1. Chi-square (4 points, 1 per column) Category Observed Expected O – E (O – E)2 (O – E)2/E No, Domestic 128 163.31 -35.31 1246..796 7.64 No, Not Domestic 675 639.69 35.31 1246.796 1.95 Yes, Domestic 245 209.69 35.31 11506.85 5.951.52 Yes, Not Domestic 786 821.31 -35.31 1246.796 Using an alpha level of 0.05, are domestic calls more dangerous for officers than other types of…arrow_forward
- A professor at the University of Iowa was interested in evaluating whether domestic dispute calls were more dangerous to officers than other types of calls. Collecting information on call for service and whether the call resulted in officer injury. The data is displayed in the contingency table below. Type of Call Domestic Dispute Not a Domestic Dispute Officer Injury No 128 675 Yes 245 786 Using the information to complete Table 1 and answer the questions below. Table 1. Chi-square (4 points, 1 per column) Category Observed Expected O – E (O – E)2 (O – E)2/E No, Domestic 128 No, Not Domestic 675 Yes, Domestic 245 Yes, Not Domestic 786 What is the scale of measurement of the dependent variable? What is the value for the chi-square? Using an alpha level of 0.05, what is the critical…arrow_forwardConsider the following: In general, when people diet they typically lose 10 lbs. (?σ = 2). A random sample of 16 people on the keto diet lost 15 lbs. Do people on the keto diet lose more or less weight than people on diets in general? 4. What is the research hypothesis? a) Weight loss in the keto diet sample does not differ from weight loss in the population of dieters in general (H1: X-bar = Mu) b)Weight loss in the keto diet sample does differ from weight loss in the population of dieters in general (H1: X-bar = Mu) c) Weight loss in the keto diet sample does not differ from weight loss in the population of dieters in general (H1: X-bar does not equal Mu) d) Weight loss in the keto diet sample does differ from weight loss in the population of dieters in general (H1: X-bar does not equal Mu)arrow_forwardThe following table was presented in an article summarizing a study to compare a new drug to a standard drug and to a placebo. Are there any statistically significant differences in the characteristics shown among the treatments? Justify your answerarrow_forward
arrow_back_ios
SEE MORE QUESTIONS
arrow_forward_ios
Recommended textbooks for you
 Glencoe Algebra 1, Student Edition, 9780079039897...AlgebraISBN:9780079039897Author:CarterPublisher:McGraw Hill
Glencoe Algebra 1, Student Edition, 9780079039897...
Algebra
ISBN:9780079039897
Author:Carter
Publisher:McGraw Hill
Correlation Vs Regression: Difference Between them with definition & Comparison Chart; Author: Key Differences;https://www.youtube.com/watch?v=Ou2QGSJVd0U;License: Standard YouTube License, CC-BY
Correlation and Regression: Concepts with Illustrative examples; Author: LEARN & APPLY : Lean and Six Sigma;https://www.youtube.com/watch?v=xTpHD5WLuoA;License: Standard YouTube License, CC-BY