
Operations Management
13th Edition
ISBN: 9780136860419
Author: Lee Krajewski
Publisher: Pearson Education
expand_more
expand_more
format_list_bulleted
Videos
Textbook Question
Chapter 13, Problem 18P
Question:
••• 13.18 Jose Martinez of El Paso has developed a polished stainless steel tortilla machine that makes it a “showpiece” for display in Mexican restaurants. He needs to develop a 5-month aggregate plan. His
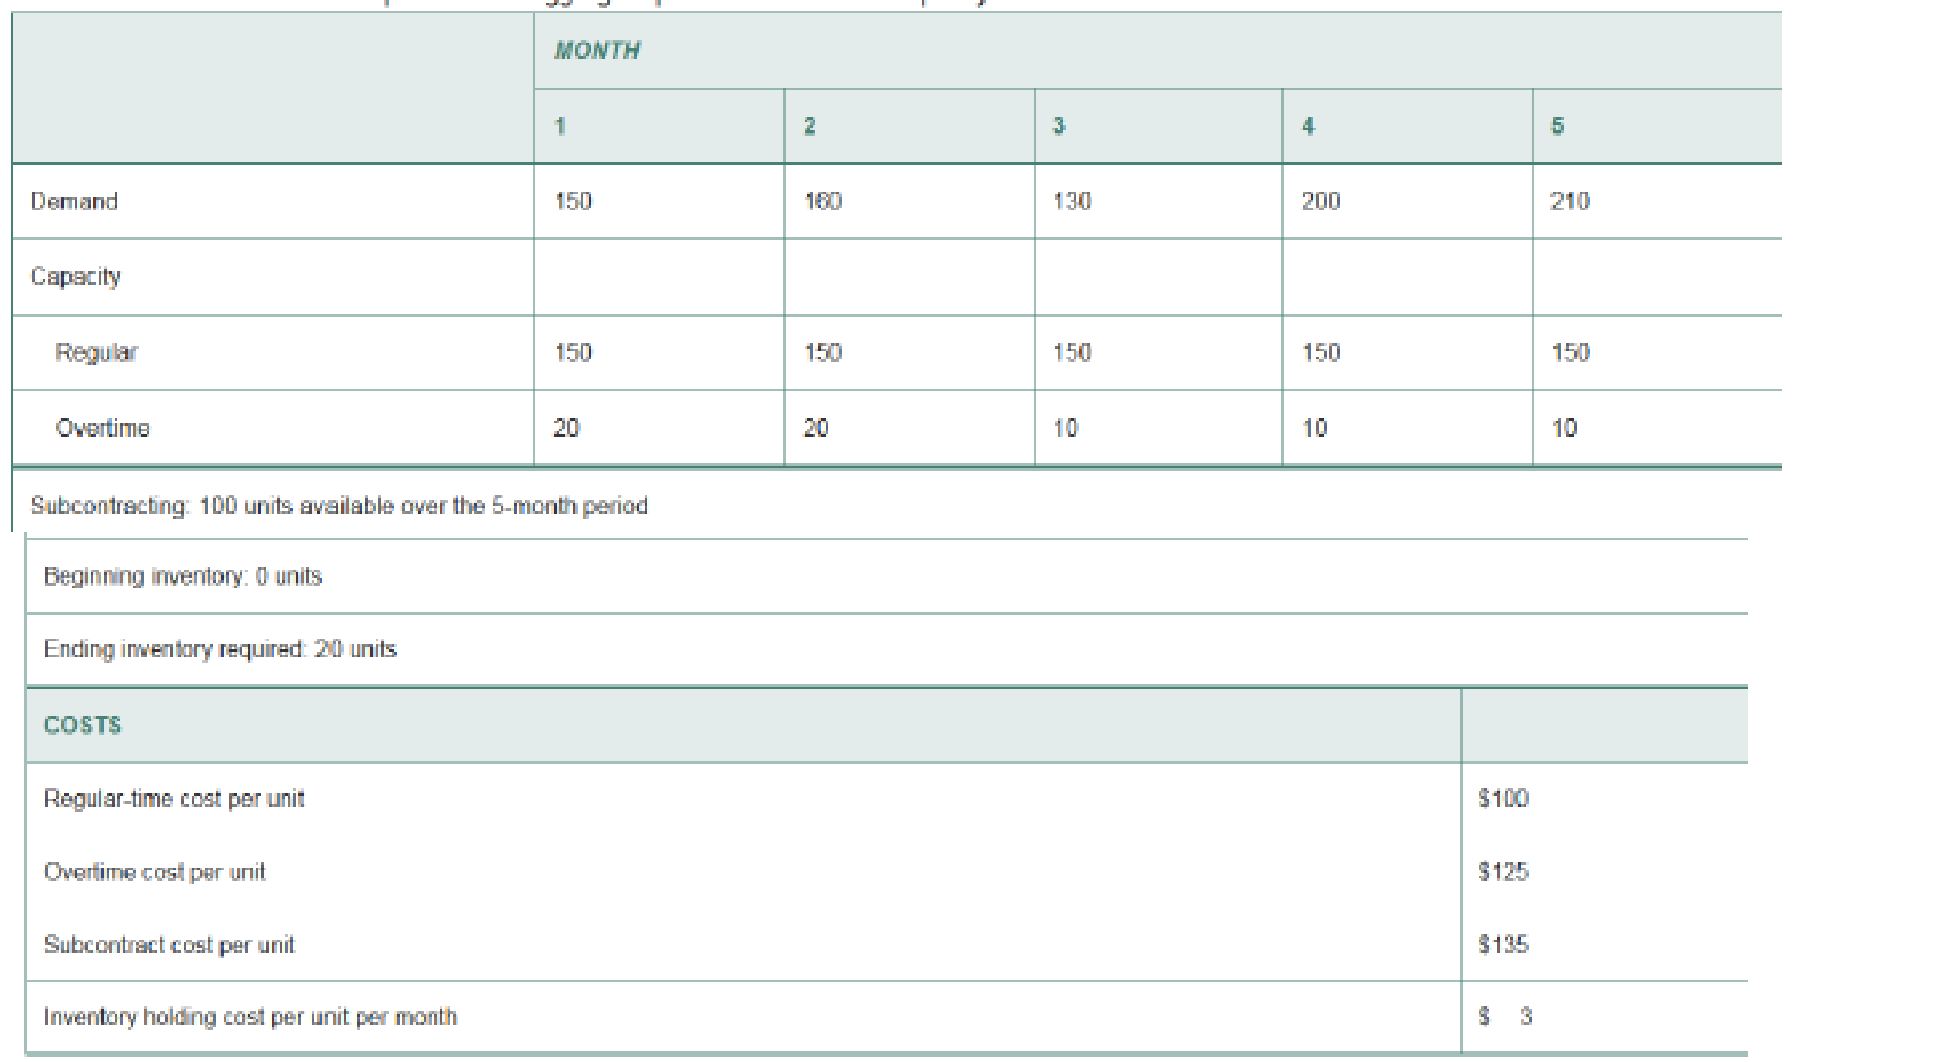
Assume that backorders are not permitted. Using the transportation method, what is the total cost of the optimal plan?
Expert Solution & Answer
Want to see the full answer?
Check out a sample textbook solution
Students have asked these similar questions
QUESTION 5
Supposing Petromin intends to build another oil refinery in PNG apart from the
existing 2 small oil refineries (refer to question 2 above). The alternatives are
to either build a big refinery, medium refinery, small refinery or no refinery at
all. It has forecast the demand for its oil against the 4 alterative as shown in
the table below.
Alternatives
Build large
refinery
Build medium
refinery
Build small
refinery
No refinery
High demand
650000
150000
70000
0
Outcomes
Moderate
demand
543000
100000
40000
0
Low demand
325000
65000
20000
0
Undertake a decision analysis. Specifically, apply the maximax, maximin,
Laplace and minimax (regret) approaches. Interpret your results.
Question 2 -
Rohe (Hong Kong) Ltd is a pharmaceutical company which manufactures and supplies various
drugs for drug stores in Asia. Currently, Rohe (Hong Kong) Ltd has four factories A, B, C and
D. Management has decided to build a new factory at a location central to these factories.
Information regarding the yearly demands and the map coordinates for the four factories are
shown in below table.
Factories e Demand e x-coord-
9,000-
y-coorde
A-
20e
130e
Be
3,000
60-
404
Ce
5,000-
70-
100-
De
16,000-
90
30
(a) Determine the map coordinates of the new factory.
(b) Suggest and elaborate TWO other factors that need to consider in the selection of location. e
May
77.000
Problem 4 (Regression Analysis, Service Company)
Bobby Gonzales owns a catering company that prepares banquets and parties
for both individual and business functions throughout the year. Gonzales
business is seasonal, with a heavy schedule during the summer months and
the year-end holidays and a light schedule at other times. During peak
periods there are extra costs.
One of the major events Gonzales' customers request is a cocktail party. He
offers a standard cocktail party and has developed the following cost
structure on a per person basis.
Food and bevernges
Labor (0.5 hour x PIO per hour)
Overhead (0.5 hour x P14 per hour)
Total costs per person
PI5.00
5.00
7.00
P27.00
Gonzales is quite certain about his estimates of the food, beverages, and
labor costs but is not as comfortable with the overhead estimate. This
estimate was based on the actual data for the past 12 months presented
below. These data indicate that overhead costs vary with the direct labor-
hours used. The…
Chapter 13 Solutions
Operations Management
Ch. 13 - Prob. 1DQCh. 13 - Why are SOP teams typically cross-functional?Ch. 13 - Prob. 3DQCh. 13 - Prob. 4DQCh. 13 - Prob. 5DQCh. 13 - Prob. 6DQCh. 13 - Question: 7. What is level scheduling? What is the...Ch. 13 - Question: 8. Define mixed strategy. Why would a...Ch. 13 - Prob. 9DQCh. 13 - Prob. 10DQ
Ch. 13 - Question: 11. What is the relationship between the...Ch. 13 - Prob. 12DQCh. 13 - Question: 13. What are major limitations of using...Ch. 13 - Prob. 14DQCh. 13 - Question: 13.1 Prepare a graph of the monthly...Ch. 13 - Prob. 2PCh. 13 - The president of Hill Enterprises, Terri Hill,...Ch. 13 - Prob. 4PCh. 13 - Prob. 5PCh. 13 - Prob. 6PCh. 13 - Prob. 7PCh. 13 - Prob. 8PCh. 13 - Prob. 9PCh. 13 - Question: 13.10 The SOP team (see Problem 13.9)...Ch. 13 - Prob. 11PCh. 13 - Prob. 12PCh. 13 - Prob. 13PCh. 13 - Question: 13.14 Jerusalem Medical Ltd., an...Ch. 13 - Prob. 15PCh. 13 - Prob. 16PCh. 13 - Prob. 17PCh. 13 - Question: 13.18 Jose Martinez of El Paso has...Ch. 13 - Prob. 19PCh. 13 - Prob. 23PCh. 13 - Prob. 24PCh. 13 - Prob. 25PCh. 13 - Prob. 26PCh. 13 - Prob. 1CSCh. 13 - Prob. 2CSCh. 13 - Prob. 1.1VCCh. 13 - Prob. 1.2VCCh. 13 - Question: 3. What are some concerns the team needs...
Knowledge Booster


Learn more about
Need a deep-dive on the concept behind this application? Look no further. Learn more about this topic, operations-management and related others by exploring similar questions and additional content below.Similar questions
- Question 3 (Module 2): In the past, Arup Mukherjee's tire dealership in Sudbury sold an average of 1,000 radials each year. In the past two years, 200 and 250, respectively, were sold in fall, 350 and 300 in winter, 150 and 165 in spring, and 300 and 285 in summer. With a major expansion planned, Mukherjee projects sales next year to increase to 1,200 radials. What will be the demand during each season?arrow_forwardQuestion 4. Formulate this problem as a LP in which the objective is to minimize the total cost? What is the name of this problem? Three suppliers (S₁, S₂, S3) are used to provide four customers (T₁, T2, T3, T4) with their requirements for a particular commodity over a year. The yearly capac- ities of the suppliers and requirements of the customers are given below (in suitable units) Suppliers Capacities (per year) Customers Requirements (per year) S₁ Table 5.3 Supplier S₁ 135 56 The unit costs for supplying each customer from each supplier are given in Table 5.3 (in pounds per unit). T₁ 132 85 106 S₂ S₁ 93 T₁ T₂ T₁ T4 62 83 39 91 T₂ _a 91 89 Customer T3 97 100 T4 103 98 "A dash indicates the impossibility of certain suppliers for cer- tain depots or customers.arrow_forwardQuestion 3. There are a number of key risks that the logistics function may face. Explain five typical immediate responses that can be used to deal with these risks.arrow_forward
- Q14 Which statement regarding this transportation table is best? (Please download the attached PDF file). Unit transportation costs are given as follow: From A to W: $3 From A to X = $5 From A to Y = $9 From B to W: $5 From B to X $4 From B to Y = $7 From C to W: $10 From C to X = $8 From C to Y = $3 Destination W Y Сарacity A 20 50 70 30 30 C 40 80 120 Demand 60 80 80 220 A. The solution is degenerate. B. This solution can be improved by shipping from C to X. C. This solution would be improved by shipping from B to W. D. This solution is optimal.arrow_forwardSeat Work Find initial basic feasible solution using • North West Corner Rule • Column Minimum Method Row Minimum Method • Matrix Minimum Method To Availability 7 2 11 10 3 4 From 1 4 7 2 1 3 9 4 12 9 Requirement 3 3 4 5 6 enarrow_forwardQuestion 1 Material planning is the key function of material management. It is very closely linkedwith project planning and control. Explain TWO (2) example of poor materialmanagement and solution to solve of the problem.arrow_forward
- Situation: The Hawkins Supply company is currently faced with an inventory rotation problem. This difficulty stems from the fact that some supplies must be used prior to a stated expiration date. Upon receipt, a new shipment of these perishable items must be stacked beneath the boxes that are currently in inventory. A substantial amount of time is consumed in restacking the items according to their expiration dates. Question: The company would like to reduce the double and sometimes triple handling of items. How can this goal be achieved? Are there alternative solutions which might also be effective?arrow_forwardQuestion 3 Regular output capacity is 130 units per month. Regular cost per unit = K600. Overtime cost per unit K900. Beginning inventory is 0 units. We have the forecast of engine demand shown below: a) Develop a chase plan that matches the forecast. Calculate the cost of the plan. b) Develop a level plan that uses inventory to absorb fluctuations. Compare the costs of the level plan to the costs of the chase plan from Part (a). Inventory carrying cost per unit per month = 20. Backlog cost per unit per month = K900. There should be no backlog in the final month. Month Forecast 1 120 2 3 135 140 4 120 End of assignment 1 5 125 6 125 7 140 = 8 135 Total 1,040arrow_forwardQUESTION ONE The diagram below shows demand and supply curves for good K; where Do and So are the initial demand and supply curves, respectively. A tax is levied on each unit of the good sold. Use the information provided in the diagram to answer the questions that follow. Price Si GH¢ 3.10 so GH¢ 2.70 GH¢ 2.00 Do 7 9 Quantity demanded and supplied 1. Find the per unit tax levied.arrow_forward
- Question 1 (a) Beijing Daxing International Airport (PKX), China’s new USD11 billion mega airport in Beijing was opened in September 2019 (Source: BBC News, 2019). The new airport is located around 46 km from Tiananmen Square. Noise pollution from aircraft is a major concern especially for the dense population living in the vicinity. Authorities have been working with the aviation community to address these concerns during the planning stages and even now when the airport is in operation. With reference to PKX, propose three (3) strategies that you think can be applied for noise reduction or abatement at PKX. Give reasons why you chose these strategies.arrow_forwardQuestion 2 Rohe (Hong Kong) Ltd is a pharmaceutical company which manufactures and supplies various drugs for drug stores in Asia. Currently, Rohe (Hong Kong) Ltd has four factories A, B, C and D. Management has decided to build a new factory at a location central to these factories. Information regarding the yearly demands and the map coordinates for the four factories are shown in below table. Factories Demand - x-coord 9,000- 3,000- 5,000 y-coord 130 40 A Be 20 60 Ce 70 100 De 16,000- 90 30 (a) Determine the map coordinates of the new factory. (b) Suggest and elaborate TWO other factors that need to consider in the selection of location. «arrow_forwardCost Classification Discussion Question The table below shows monthly data collected on production costs and on the number of units produced over a twelve month period. Month Total Production Costs Level of Activity (Units Produced) July $230,000 3,500 August 250,000 3,750 September 260,000 3,800 October 220,000 3,400 November 340,000 5,800 December 330,000 5,500 January 200,000 2,900 February 210,000 3,300 March 240,000 3,600 April 380,000 5,900 May 350,000 5,600 June 290,000 5,000 Prepare the scatter diagram and insert the trendline or line of best-fit. Use a scale of 2 cm to represent 1,000 units on the x-axis & 2 cm to represent $50,000 on the yaxis. Using the line of best-fit, determine the company’s fixed cost per month and the variable cost per unit. (Use 0 & 5,000 units.) I'd like to see a breakdown please. Which of the two methods appear more appropriate?…arrow_forward
arrow_back_ios
SEE MORE QUESTIONS
arrow_forward_ios
Recommended textbooks for you
 Practical Management ScienceOperations ManagementISBN:9781337406659Author:WINSTON, Wayne L.Publisher:Cengage,
 Operations ManagementOperations ManagementISBN:9781259667473Author:William J StevensonPublisher:McGraw-Hill Education
 Operations and Supply Chain Management (Mcgraw-hi...Operations ManagementISBN:9781259666100Author:F. Robert Jacobs, Richard B ChasePublisher:McGraw-Hill Education
 Purchasing and Supply Chain ManagementOperations ManagementISBN:9781285869681Author:Robert M. Monczka, Robert B. Handfield, Larry C. Giunipero, James L. PattersonPublisher:Cengage Learning
 Production and Operations Analysis, Seventh Editi...Operations ManagementISBN:9781478623069Author:Steven Nahmias, Tava Lennon OlsenPublisher:Waveland Press, Inc.
Practical Management Science
Operations Management
ISBN:9781337406659
Author:WINSTON, Wayne L.
Publisher:Cengage,
Operations Management
Operations Management
ISBN:9781259667473
Author:William J Stevenson
Publisher:McGraw-Hill Education
Operations and Supply Chain Management (Mcgraw-hi...
Operations Management
ISBN:9781259666100
Author:F. Robert Jacobs, Richard B Chase
Publisher:McGraw-Hill Education
Purchasing and Supply Chain Management
Operations Management
ISBN:9781285869681
Author:Robert M. Monczka, Robert B. Handfield, Larry C. Giunipero, James L. Patterson
Publisher:Cengage Learning
Production and Operations Analysis, Seventh Editi...
Operations Management
ISBN:9781478623069
Author:Steven Nahmias, Tava Lennon Olsen
Publisher:Waveland Press, Inc.
Forecasting 2: Forecasting Types & Qualitative methods; Author: Adapala Academy & IES GS for Exams;https://www.youtube.com/watch?v=npWni9K6Z_g;License: Standard YouTube License, CC-BY
Introduction to Forecasting - with Examples; Author: Dr. Bharatendra Rai;https://www.youtube.com/watch?v=98K7AG32qv8;License: Standard Youtube License