
Marginal revenue curve.
Explanation of Solution
Marginal revenue curve and profit maximizing level of price and quantity are shown in a figure.
Figure 1 shows profit maximizing price, quantity and
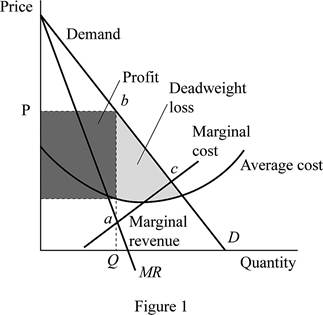
In figure 1, the vertical axis measure price and horizontal axis measure quantity. The downward sloping curve “D” is the demand curve and downward sloping curve “MR” is the marginal revenue curve. “P” is the profit maximizing price and “Q” is the profit maximizing quantity. The profit earned is shown in dark shaded rectangle in the figure. Deadweight loss created is shown in the light shaded triangle “abc”. The deadweight loss is the decrease in the total surplus caused by markets distortions or market inefficiency. The profit earned is shown in dark shaded rectangle in the figure.
Concept introduction:
Marginal revenue curve: Marginal revenue curve shows the additional revenue that will be generated by increasing product sales by one unit.
Want to see more full solutions like this?
Chapter 13 Solutions
Loose-leaf Version for Modern Principles of Microeconomics 4e & SaplingPlus for Modern Principles of Microeconomics 4e (Six Months Access)


 Principles of Economics (12th Edition)EconomicsISBN:9780134078779Author:Karl E. Case, Ray C. Fair, Sharon E. OsterPublisher:PEARSON
 Engineering Economy (17th Edition)EconomicsISBN:9780134870069Author:William G. Sullivan, Elin M. Wicks, C. Patrick KoellingPublisher:PEARSON
 Principles of Economics (MindTap Course List)EconomicsISBN:9781305585126Author:N. Gregory MankiwPublisher:Cengage Learning
 Managerial Economics: A Problem Solving ApproachEconomicsISBN:9781337106665Author:Luke M. Froeb, Brian T. McCann, Michael R. Ward, Mike ShorPublisher:Cengage Learning
 Managerial Economics & Business Strategy (Mcgraw-...EconomicsISBN:9781259290619Author:Michael Baye, Jeff PrincePublisher:McGraw-Hill Education