
Videos
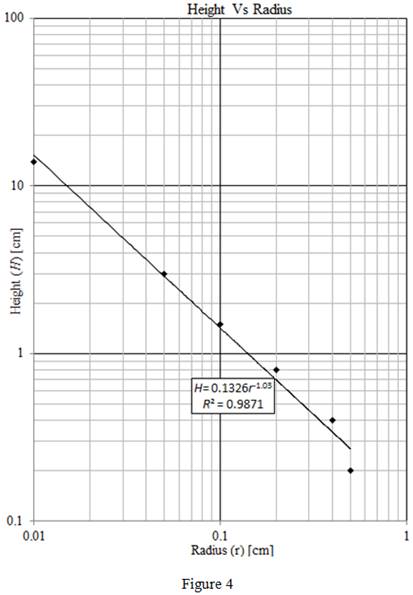
Show the resulting data and trend lines, with equation and
Answer to Problem 1ICA
The data and trend line with equation and
Explanation of Solution
Description:
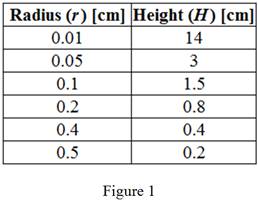
Step 1: Open the Excel Sheet, and enter the data as shown in Figure 1.
Step 2: Select all the data from columns Radius and Height.
Step 3: Now, go to the Insert tab in the Excel and click on the Scatter Plot.
Step 4: Change the property of the plot to get the linear plot as follows.
- Click on the y-axis, select format axis as shown in Figure 2.
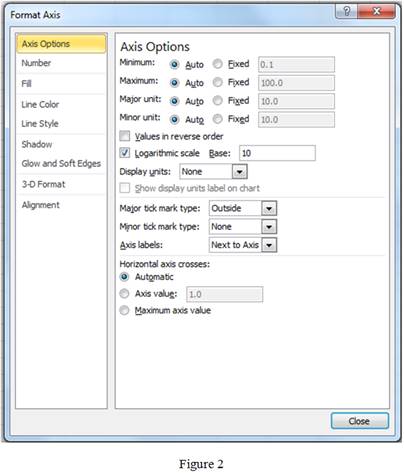
- Similarly, click on the x-axis and format the axis.
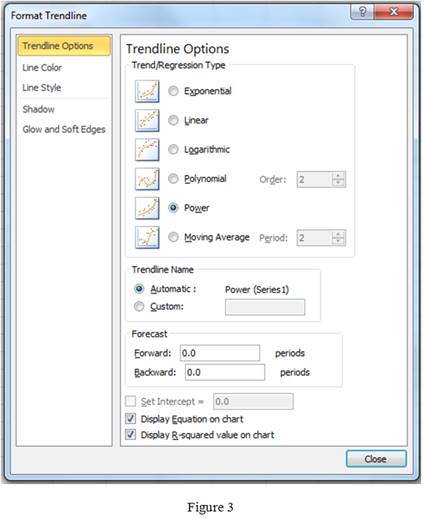
Step 5: Click on points and add trendline as shown in Figure 3.
Step 6: Label the axis of the plot properly as per the format shown below.
Step 7: Mention the title of the plot as shown in Figure 4.
Conclusion:
Hence, the data and trend line with equation and
Want to see more full solutions like this?
Chapter 13 Solutions
Thinking Like an Engineer: An Active Learning Approach (3rd Edition)


 Elements Of ElectromagneticsMechanical EngineeringISBN:9780190698614Author:Sadiku, Matthew N. O.Publisher:Oxford University Press
 Mechanics of Materials (10th Edition)Mechanical EngineeringISBN:9780134319650Author:Russell C. HibbelerPublisher:PEARSON
 Thermodynamics: An Engineering ApproachMechanical EngineeringISBN:9781259822674Author:Yunus A. Cengel Dr., Michael A. BolesPublisher:McGraw-Hill Education
 Control Systems EngineeringMechanical EngineeringISBN:9781118170519Author:Norman S. NisePublisher:WILEY
 Mechanics of Materials (MindTap Course List)Mechanical EngineeringISBN:9781337093347Author:Barry J. Goodno, James M. GerePublisher:Cengage Learning
 Engineering Mechanics: StaticsMechanical EngineeringISBN:9781118807330Author:James L. Meriam, L. G. Kraige, J. N. BoltonPublisher:WILEY