
BASIC BUSINESS STATISTICS
14th Edition
ISBN: 9780135285923
Author: MARK BERENSON
Publisher: PEARSON
expand_more
expand_more
format_list_bulleted
Concept explainers
Videos
Textbook Question
Chapter 13, Problem 24PS
The following results show the
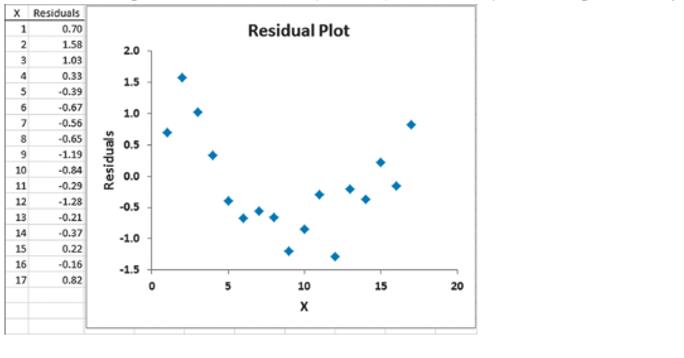
Is there any evidence of a pattern in the residuals? Explain.
Expert Solution & Answer
Want to see the full answer?
Check out a sample textbook solution
Chapter 13 Solutions
BASIC BUSINESS STATISTICS
Ch. 13 - Prob. 1PSCh. 13 - If the values of X in Problem 13.1 from 2 to 25,...Ch. 13 - Fitting a straight line to a set data yields the...Ch. 13 - The production of wine is a multibillion-dollar...Ch. 13 - Zagat’s publisher restaurant rating for various...Ch. 13 - Is an MBA a golden ticket? Pursuing an MBA is a...Ch. 13 - Starbucks Coffee Co. uses a data-based approach to...Ch. 13 - The value of a sports franchise is directly...Ch. 13 - An agent for a residential real estate company in...Ch. 13 - A box office analyst seeks to predict opening...
Ch. 13 - How do you interpret a coefficient by of...Ch. 13 - If SSR= 36 and SSE=4, determine SST and then...Ch. 13 - If SSR=66 and SST=88, Compute the coefficient of...Ch. 13 - If SSE= 10 and SSR=30, compute the coefficient of...Ch. 13 - If SSR=120, Why is it impossible for SST to equal...Ch. 13 - In problem 13.4 on page 493, the percentage of...Ch. 13 - In problem 13.5 on page 493, you used the summated...Ch. 13 - In Problem 13.6 on page 494, a prospective MBA...Ch. 13 - In Problem 13.7 on page 494, you used the plate...Ch. 13 - In problem 13.8 on page 494, you used annual...Ch. 13 - In problem 13.9 on page 494, an agent for a real...Ch. 13 - In problem 13.10 on page 494, you used You tube...Ch. 13 - The following results provide the X Values,...Ch. 13 - The following results show the X Values,...Ch. 13 - In problem 13.5 on page 493, you used the summated...Ch. 13 - In problem 13.4 on page 493, you used the...Ch. 13 - In problem 13.7 on page 494, you used the plate...Ch. 13 - In problem 13.6 on page 494, a prospective MBA...Ch. 13 - In problem 13.9 on page 494, an agent for a real...Ch. 13 - Prob. 30PSCh. 13 - Prob. 31PSCh. 13 - The residuals for 10 consecutive time periods are...Ch. 13 - The residuals for 15 consecutive time periods are...Ch. 13 - In Problem 13.7 on page 494 concerning the...Ch. 13 - What is the relationship between the price of...Ch. 13 - Prob. 36PSCh. 13 - A freshly brewed shot of espresso has three...Ch. 13 - The owners of a chain of ice cream stores have the...Ch. 13 - You are testing the null hypothesis that there is...Ch. 13 - Prob. 40PSCh. 13 - Prob. 41PSCh. 13 - In problem 13.4 on page 493, you used the...Ch. 13 - Prob. 43PSCh. 13 - In problem 13.6 on page 494, a prospective MBA...Ch. 13 - In Problem 13.7 on page 494, you used the plate...Ch. 13 - Prob. 46PSCh. 13 - In Problem 13.9 on page 494, an agent for a real...Ch. 13 - In Problem 13.10 on page 494, you used you used...Ch. 13 - The volatility of a stock is often measured by its...Ch. 13 - Prob. 50PSCh. 13 - Prob. 51PSCh. 13 - Movie companies need to predict the gross receipts...Ch. 13 - Prob. 53PSCh. 13 - Prob. 54PSCh. 13 - Prob. 55PSCh. 13 - Based on a sample of n=20, the latest-squares...Ch. 13 - Prob. 57PSCh. 13 - In Problem 13.4 on page 493, you used the...Ch. 13 - In Problem 13.7 on page 494, you used the plate...Ch. 13 - In Problem 13.6 on page 494, a prospective MBA...Ch. 13 - Prob. 61PSCh. 13 - Prob. 62PSCh. 13 - In problem 13.10 on page 494, you used YouTube...Ch. 13 - Prob. 64PSCh. 13 - Prob. 65PSCh. 13 - When is the unexplained variation (i.e., error sum...Ch. 13 - Prob. 67PSCh. 13 - Prob. 68PSCh. 13 - Prob. 69PSCh. 13 - How do you evaluate the assumptions of regression...Ch. 13 - When and how do you use the Durbin-Watson...Ch. 13 - Prob. 72PSCh. 13 - Can you use movie critics’ opinions to forecast...Ch. 13 - Management of a soft-drink botting company has the...Ch. 13 - Measuring the height of a California redwood tree...Ch. 13 - You want to develop a model to predict the asking...Ch. 13 - You want to develop a model to predict the taxes...Ch. 13 - An analyst has the objective of predicting the...Ch. 13 - An accountant for a large department store has the...Ch. 13 - On January 28, 1986, the space shuttle Challenger...Ch. 13 - A baseball analyst would like to study various...Ch. 13 - Can you use the annual revenues generated by...Ch. 13 - In Problem 13.82 you used annual revenue to...Ch. 13 - During the fall harvest season in the United...Ch. 13 - Refer to the discussion of beta values and market...Ch. 13 - The file CEO 2016 includes the total compensation...Ch. 13 - In Problem 13.8, 13.20, 13.30, 13.46, 13.62,...
Knowledge Booster


Learn more about
Need a deep-dive on the concept behind this application? Look no further. Learn more about this topic, statistics and related others by exploring similar questions and additional content below.Similar questions
- Find the equation of the regression line for the following data set. x 1 2 3 y 0 3 4arrow_forwardFor the following exercises, use Table 4 which shows the percent of unemployed persons 25 years or older who are college graduates in a particular city, by year. Based on the set of data given in Table 5, calculate the regression line using a calculator or other technology tool, and determine the correlation coefficient. Round to three decimal places of accuracyarrow_forwardLife Expectancy The following table shows the average life expectancy, in years, of a child born in the given year42 Life expectancy 2005 77.6 2007 78.1 2009 78.5 2011 78.7 2013 78.8 a. Find the equation of the regression line, and explain the meaning of its slope. b. Plot the data points and the regression line. c. Explain in practical terms the meaning of the slope of the regression line. d. Based on the trend of the regression line, what do you predict as the life expectancy of a child born in 2019? e. Based on the trend of the regression line, what do you predict as the life expectancy of a child born in 1580?2300arrow_forward
- For the following exercises, consider the data in Table 5, which shows the percent of unemployed in a city ofpeople25 years or older who are college graduates is given below, by year. 41. Based on the set of data given in Table 7, calculatethe regression line using a calculator or othertechnology tool, and determine the correlationcoefficient to three decimal places.arrow_forwardFor the following exercises, consider the data in Table 5, which shows the percent of unemployed ina city of people 25 years or older who are college graduates is given below, by year. 40. Based on the set of data given in Table 6, calculate the regression line using a calculator or other technology tool, and determine the correlation coefficient to three decimal places.arrow_forwardXYZ Corporation Stock Prices The following table shows the average stock price, in dollars, of XYZ Corporation in the given month. Month Stock price January 2011 43.71 February 2011 44.22 March 2011 44.44 April 2011 45.17 May 2011 45.97 a. Find the equation of the regression line. Round the regression coefficients to three decimal places. b. Plot the data points and the regression line. c. Explain in practical terms the meaning of the slope of the regression line. d. Based on the trend of the regression line, what do you predict the stock price to be in January 2012? January 2013?arrow_forward
- What is regression analysis? Describe the process of performing regression analysis on a graphing utility.arrow_forwardOlympic Pole Vault The graph in Figure 7 indicates that in recent years the winning Olympic men’s pole vault height has fallen below the value predicted by the regression line in Example 2. This might have occurred because when the pole vault was a new event there was much room for improvement in vaulters’ performances, whereas now even the best training can produce only incremental advances. Let’s see whether concentrating on more recent results gives a better predictor of future records. (a) Use the data in Table 2 (page 176) to complete the table of winning pole vault heights shown in the margin. (Note that we are using x=0 to correspond to the year 1972, where this restricted data set begins.) (b) Find the regression line for the data in part ‚(a). (c) Plot the data and the regression line on the same axes. Does the regression line seem to provide a good model for the data? (d) What does the regression line predict as the winning pole vault height for the 2012 Olympics? Compare this predicted value to the actual 2012 winning height of 5.97 m, as described on page 177. Has this new regression line provided a better prediction than the line in Example 2?arrow_forwardNoise and Intelligibility Audiologists study the intelligibility of spoken sentences under different noise levels. Intelligibility, the MRT score, is measured as the percent of a spoken sentence that the listener can decipher at a cesl4ain noise level in decibels (dB). The table shows the results of one such test. (a) Make a scatter plot of the data. (b) Find and graph the regression line. (c) Find the correlation coefficient. Is a linear model appropriate? (d) Use the linear model in put (b) to estimate the intelligibility of a sentence at a 94-dB noise level.arrow_forward
arrow_back_ios
arrow_forward_ios
Recommended textbooks for you
 Glencoe Algebra 1, Student Edition, 9780079039897...AlgebraISBN:9780079039897Author:CarterPublisher:McGraw Hill
 Big Ideas Math A Bridge To Success Algebra 1: Stu...AlgebraISBN:9781680331141Author:HOUGHTON MIFFLIN HARCOURTPublisher:Houghton Mifflin Harcourt
 Functions and Change: A Modeling Approach to Coll...AlgebraISBN:9781337111348Author:Bruce Crauder, Benny Evans, Alan NoellPublisher:Cengage Learning
 Trigonometry (MindTap Course List)TrigonometryISBN:9781337278461Author:Ron LarsonPublisher:Cengage Learning
Glencoe Algebra 1, Student Edition, 9780079039897...
Algebra
ISBN:9780079039897
Author:Carter
Publisher:McGraw Hill
Big Ideas Math A Bridge To Success Algebra 1: Stu...
Algebra
ISBN:9781680331141
Author:HOUGHTON MIFFLIN HARCOURT
Publisher:Houghton Mifflin Harcourt
Functions and Change: A Modeling Approach to Coll...
Algebra
ISBN:9781337111348
Author:Bruce Crauder, Benny Evans, Alan Noell
Publisher:Cengage Learning
Trigonometry (MindTap Course List)
Trigonometry
ISBN:9781337278461
Author:Ron Larson
Publisher:Cengage Learning
Correlation Vs Regression: Difference Between them with definition & Comparison Chart; Author: Key Differences;https://www.youtube.com/watch?v=Ou2QGSJVd0U;License: Standard YouTube License, CC-BY
Correlation and Regression: Concepts with Illustrative examples; Author: LEARN & APPLY : Lean and Six Sigma;https://www.youtube.com/watch?v=xTpHD5WLuoA;License: Standard YouTube License, CC-BY