
Concept explainers
Videos
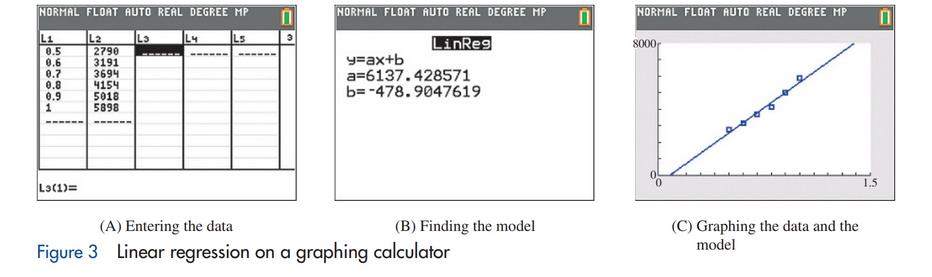
As stated previously, we used linear regression to produce the model in Example 3. If you have a graphing calculator that supports linear regression, then you can find this model. The linear regression process varies greatly from one calculator to another. Consult the user’s manual for the details of linear regression. The screens in Figure 3 are related to the construction of the model in Example 3 on a Texas Instruments TI-84 Plus CE.
(A) Produce similar screens on your graphing calculator.
(B) Do the same for Matched Problem 3.
Want to see the full answer?
Check out a sample textbook solution
Chapter 1 Solutions
Finite Mathematics for Business, Economics, Life Sciences and Social Sciences
Additional Math Textbook Solutions
Excursions in Modern Mathematics (9th Edition)
Calculus Volume 1
Calculus for Business, Economics, Life Sciences, and Social Sciences (14th Edition)
Thinking Mathematically (7th Edition)
A Survey of Mathematics with Applications (10th Edition) - Standalone book
Mathematical Ideas (13th Edition) - Standalone book


- Olympic Pole Vault The graph in Figure 7 indicates that in recent years the winning Olympic men’s pole vault height has fallen below the value predicted by the regression line in Example 2. This might have occurred because when the pole vault was a new event there was much room for improvement in vaulters’ performances, whereas now even the best training can produce only incremental advances. Let’s see whether concentrating on more recent results gives a better predictor of future records. (a) Use the data in Table 2 (page 176) to complete the table of winning pole vault heights shown in the margin. (Note that we are using x=0 to correspond to the year 1972, where this restricted data set begins.) (b) Find the regression line for the data in part ‚(a). (c) Plot the data and the regression line on the same axes. Does the regression line seem to provide a good model for the data? (d) What does the regression line predict as the winning pole vault height for the 2012 Olympics? Compare this predicted value to the actual 2012 winning height of 5.97 m, as described on page 177. Has this new regression line provided a better prediction than the line in Example 2?arrow_forwardFor the following exercises, use Table 4 which shows the percent of unemployed persons 25 years or older who are college graduates in a particular city, by year. Determine whether the trend appears linear. If so, and assuming the trend continues, find a linear regression model to predict the percent of unemployed in a given year to three decimal places.arrow_forwardThe following fictitious table shows kryptonite price, in dollar per gram, t years after 2006. t= Years since 2006 0 1 2 3 4 5 6 7 8 9 10 K= Price 56 51 50 55 58 52 45 43 44 48 51 Make a quartic model of these data. Round the regression parameters to two decimal places.arrow_forward
- For the following exercises, consider this scenario: The profit of a company decreased steadily overa ten-year spam.The following ordered pairs shows dollars and the number of units sold in hundreds and the profit in thousands ofover the ten-year span, (number of units sold, profit) for specific recorded years: (46,600),(48,550),(50,505),(52,540),(54,495). Use linear regression to determine a function Pwhere the profit in thousands of dollars depends onthe number of units sold in hundreds.arrow_forwardIf your graphing calculator is capable of computing a least-squares sinusoidal regression model, use it to find a second model for the data. Graph this new equation along with your first model. How do they compare?arrow_forwardFor the following exercises, consider this scenario: The population of a city increased steadily over a ten-year span.The following ordered pairs show the population and the year over the ten-year span (population, year) for specific recorded years: (3,600,2000);(4,000,2001);(4,700,2003);(6,000,2006) 42. Use linear regression to determine a function y,where the year depends on the population, to threedecimal places of accuracy.arrow_forward
- Find the equation of the regression line for the following data set. x 1 2 3 y 0 3 4arrow_forwardbThe average rate of change of the linear function f(x)=3x+5 between any two points is ________.arrow_forwardDoes Table 1 represent a linear function? If so, finda linear equation that models the data.arrow_forward

 Algebra & Trigonometry with Analytic GeometryAlgebraISBN:9781133382119Author:SwokowskiPublisher:Cengage
 Trigonometry (MindTap Course List)TrigonometryISBN:9781305652224Author:Charles P. McKeague, Mark D. TurnerPublisher:Cengage Learning
 College AlgebraAlgebraISBN:9781305115545Author:James Stewart, Lothar Redlin, Saleem WatsonPublisher:Cengage Learning
 Functions and Change: A Modeling Approach to Coll...AlgebraISBN:9781337111348Author:Bruce Crauder, Benny Evans, Alan NoellPublisher:Cengage Learning
 Algebra and Trigonometry (MindTap Course List)AlgebraISBN:9781305071742Author:James Stewart, Lothar Redlin, Saleem WatsonPublisher:Cengage Learning