
Concept explainers
Videos
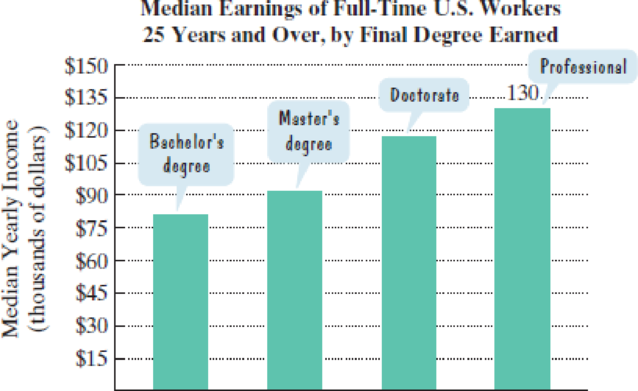
The bar graph shows median yearly earnings of full-time workers in the United States for people 25 years and over with a college education, by final degree earned. Exercises 3–4 are based on the data displayed by the graph.
Source: U.S. Census Bureau
(Exercises 3–4 are based on the graph at the bottom-right of the previous page.)
4. The median yearly salary of an American whose final degree is a doctorate is $45 thousand less than twice that of an American whose final degree is a bachelor’s. Combined, two people with each of these educational attainments earn $198 thousand. Find the median yearly salary of Americans with each of these final degrees.
Want to see the full answer?
Check out a sample textbook solution
Chapter 1 Solutions
College Algebra Essentials, Books A La Carte Edition Plus MyLab Math with eText -- Access Card Package (5th Edition)


- the table shows the percent of households with internet access for selected years from 2009 and projected through 2015. Year Percent of households 2009 67 2010 70 2011 72.5 2012 75 2013 76.5 2014 77.2 2015 78 Use the model to predict the percent of households with internet access in 2022.arrow_forwardRedo exercises 21 through 23 in section 8.2 of your textbook, about the three types of employment in a small town, using the following data:arrow_forwardEnsure that you utilize the five-step model and show all your work when addressing the question. Assuming there is a relationship, what is the strength of this relationship? Political Views Class Standing Freshman and Sophomore Class Standing Junior and Senior Totals Liberal 40 43 83 Moderate 50 50 100 Conservative 44 40 84 Totals 134 133 267arrow_forward
- For the following line graph, State at least one type of conclusion that could be made from the data provided for the KPI. Suggest one other data source that would provide more information to make data-driven decisions. Explain what information that source would supply. (I used the clustered bar chart) Examples: 1) The completion KPI measures the percentage of South Texas College students who finished their degree or certificate program within six years. From the line graph, it can be seen that the completion rates have remained nearly constant through the years. Data from the THECB was used in this case. 2) Information about the percentage of students who receive credit for attempted courses is available on the South Texas College KPI webpage. According to the data, over the past five years, an increasing number of students have been receiving credit for courses they have attempted. Data on the percentage of students who complete courses, the percentage of students who withdraw…arrow_forwardFor the following line graph, State at least one type of conclusion that could be made from the data provided for the KPI. Suggest one other data source that would provide more information to make data-driven decisions. Explain what information that source would supply. I used the line graph btw. Examples: 1)The KPI webpage for South Texas College provides information on the proportion of graduates who find employment. According to the data, over the past five years, the proportion of graduates who find work has risen annually. Data on the percentage of students who are employed in their field of study after graduation, the percentage of students who are employed full-time after graduation, and the percentage of students who are satisfied with their job after graduation would also be useful in making decisions about post-graduation success. This information would shed light on the factors that are causing the rise in the proportion of graduates who find employment. 2)The…arrow_forwardUse the data and develop a model to predict Overall Satisfaction. If a customer reports satisfaction with trade price as 3.3 and satisfaction with the speed of execution as 2.6, we can predict their overall satisfaction to be what? (Keep one decimal place) Brokerage Satisfaction with Trade Price Satisfaction with Speed of Execution Overall Satisfaction with Electronic Trades Scottrade, Inc. 3.4 3.4 3.5 Charles Schwab 3.2 3.3 3.4 Fidelity Brokerage Services 3.1 3.4 3.9 TD Ameritrade 2.9 3.6 3.7 E*Trade Financial 2.9 3.2 2.9 (Not listed) 2.1 3.2 2.7 Vanguard Brokerage Services 2.0 3.8 2.8 USAA Brokerage Services 2.1 3.8 3.6 Thinkorswim 1.9 2.6 2.6 Wells Fargo Investments 2.2 2.7 2.3 Interactive Brokers 3.1 4.0 4.0 Zecco.com 2.5 2.5 2.5 Firstrade Securities 3.0 3.0 4.0 Banc of America Investment Services 4.0 1.0 2.0arrow_forward
- Can someone explain this from a mathematical perspective? Find a relation between the fraction of islands occupied by a species and time. There is a fixed number of islands. The distribution of the species across all islands is maintained by a balance between local extinctions and local colonization events.arrow_forwarduse the given data on the societal cost of crashes and the approximate U.S. population of 325 million to calculate the average social cost per person. U.S. Data (2016 estimates): Car Crash fatalities = 40,200; Car Crash injuries = 4.6 million; cost to society = $430 billion. (source: National Safety Council.) • Global Data (estimated); car crash fatalities = ≈ 50 million; car crash fatalities with victim's underage 45 ≈ 400,000. (Source: Association Safe International Road Travel.) About how often (once every x minutes or x seconds) on average is a person killed in a car crash in the United States? How often is a person injured in a car crash. The answer to this question is about once every 13 minutes; about once every 7 seconds. use the given data on the societal cost of crashes and the approximate U.S. population of 325 million to calculate the average social cost per person. The answer to this is about $1,320 per person. I forgot to put this so the answer can be solved. I…arrow_forwardWithout graphing, is the data set exactly linear, approximately linear or nonlinear? x- 1,2,3,4,5 y- 5,7,11,13,17arrow_forward
- An aerobic exercise instructor remembers the data given in the following table, which shows the recommended maximum exercise heart rates for individuals of the given ages. Predict the maximum exercise heart rate of a person who is 72 years old Age (x years) 20 30 40 50 60 Maximum heart rate (y beats per minute) 170 168 153 147 136arrow_forwardThe table below gives adult wine consumption.arrow_forwardAn economist at Nedbank ran a study of the relationship between FTSE/JSE All Shares index return (JALSH) and consumer price index (CPI) from 2006 to 2017, the data collected is shown in the Table 1 below. FTSE/JSE All Shares index return (JALSH) and consumer price index (CPI) from 2006 to 2017. Year JALSH (Y) CPI (X) 2006 0.41 4.7 2007 0.19 7.1 2008 -0.23 11.5 2009 0.32 7.1 2010 0.19 4.3 2011 0.03 5.0 2012 0.27 5.6 2013 0.21 5.7 2014 0.11 6.1 2015 0.05 4.6 2016 0.00 6.4 2017 0.21 5.3 The estimated regression…arrow_forward
 Algebra: Structure And Method, Book 1AlgebraISBN:9780395977224Author:Richard G. Brown, Mary P. Dolciani, Robert H. Sorgenfrey, William L. ColePublisher:McDougal Littell
 Glencoe Algebra 1, Student Edition, 9780079039897...AlgebraISBN:9780079039897Author:CarterPublisher:McGraw Hill
 Big Ideas Math A Bridge To Success Algebra 1: Stu...AlgebraISBN:9781680331141Author:HOUGHTON MIFFLIN HARCOURTPublisher:Houghton Mifflin Harcourt
 Algebra & Trigonometry with Analytic GeometryAlgebraISBN:9781133382119Author:SwokowskiPublisher:Cengage