
Concept explainers
Videos
Despite booming new car sales with their cha-ching sounds, the average age of vehicles on U.S. roads is not going down. The bar graph shows the average price of new cars in the United States and the average age of cars on U.S. roads for two selected years. Exercises 5–6 are based on the information displayed by the graph.
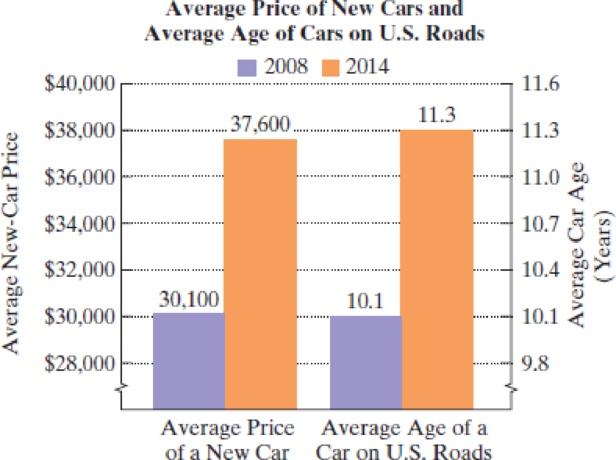
Source: Kelley Blue Book, IHS Automotive/Polk
6. In 2014, the average age of cars on U.S. roads was 11.3 years. For the period shown, this average age increased by approximately 0.2 year per year. If this trend continues, how many years after 2014 will the average age of vehicles on U.S. roads be 12.3 years? In which year will this occur?
Want to see the full answer?
Check out a sample textbook solution
Chapter 1 Solutions
College Algebra Essentials, Books A La Carte Edition Plus MyLab Math with eText -- Access Card Package (5th Edition)


- It is requiring a graph written response!arrow_forwardGraph C,D,Earrow_forwardA research study recorded the out-of-state tuition fees for a sample of public and for-profit colleges in the United States, and the results can be downloaded from the data file Tuition. Summarize this data by creating histograms with StatKey, and submit your graph as a PDF. When creating your graphs, please make sure the number of buckets is set to 10.arrow_forward
- Which of the following realities explains the practical uses of graphs? * a. Computer chips b. Supply chains c. The Internetarrow_forwarda. If the cutout length increases from 0.8 to 2.3 inches, what is the change in the box's volume? (You may use your graphing calculator.) b. If the cutout length increases from 2.3 to 4 inches, what is the change in the box's volume?arrow_forwardMake a 2-bar bar graph based off this tablearrow_forward
- The graph shows the percentage of a country's adults on weight-loss diets.arrow_forwardThe city counsel has just voted to pass the city's budget for next year. If you were writing a report describing the budget so the citizens could understand how the total tax dollars will be spent, which of the following graphs might be most appropriate? A) Ogive B) Scatter diagram C) Pie chart D) Histogramarrow_forwardUse the Learning graph above to answer this question. screenshot attached thanks hnktho3nhitn35hn35oiho 42gj24ohj24ho24jh2o 442 hjarrow_forward
 Algebra: Structure And Method, Book 1AlgebraISBN:9780395977224Author:Richard G. Brown, Mary P. Dolciani, Robert H. Sorgenfrey, William L. ColePublisher:McDougal Littell
 Elementary Geometry for College StudentsGeometryISBN:9781285195698Author:Daniel C. Alexander, Geralyn M. KoeberleinPublisher:Cengage Learning