Movie companies need to predict the gross receipts of an individual movie once the movie has debuted. The following results (stored in PotterMovies) are the first weekend gross, the U.S. gross, and the worldwide gross (in $millions ) of the eight Harry Potter movies that debuted from 2001 to 2011. a. Compute the coefficient of correlation between first weekend gross and U.S. gross, first weekend gross and worldwide gross, and U.S. gross and worldwide gross. b. At the 0.05 level of significance, is there a significant linear relationship between first weekend and U.S. gross, first weekend gross, and U.S. gross and worldwide gross?
Movie companies need to predict the gross receipts of an individual movie once the movie has debuted. The following results (stored in PotterMovies) are the first weekend gross, the U.S. gross, and the worldwide gross (in $millions ) of the eight Harry Potter movies that debuted from 2001 to 2011. a. Compute the coefficient of correlation between first weekend gross and U.S. gross, first weekend gross and worldwide gross, and U.S. gross and worldwide gross. b. At the 0.05 level of significance, is there a significant linear relationship between first weekend and U.S. gross, first weekend gross, and U.S. gross and worldwide gross?
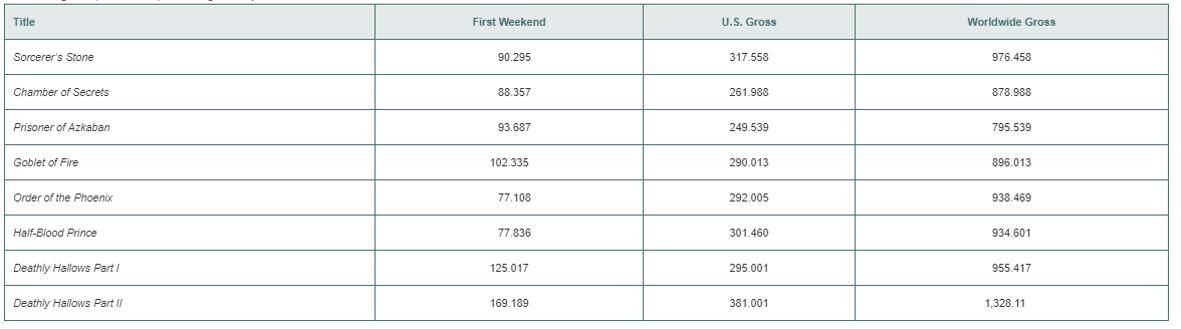
Movie companies need to predict the gross receipts of an individual movie once the movie has debuted. The following results (stored in PotterMovies) are the first weekend gross, the U.S. gross, and the worldwide gross (in
$millions
) of the eight Harry Potter movies that debuted from 2001 to 2011.
a. Compute the coefficient of correlation between first weekend gross and U.S. gross, first weekend gross and worldwide gross, and U.S. gross and worldwide gross.
b. At the 0.05 level of significance, is there a significant linear relationship between first weekend and U.S. gross, first weekend gross, and U.S. gross and worldwide gross?
Definition Definition Statistical measure used to assess the strength and direction of relationships between two variables. Correlation coefficients range between -1 and 1. A coefficient value of 0 indicates that there is no relationship between the variables, whereas a -1 or 1 indicates that there is a perfect negative or positive correlation.
Need a deep-dive on the concept behind this application? Look no further. Learn more about this topic, statistics and related others by exploring similar questions and additional content below.
Correlation Vs Regression: Difference Between them with definition & Comparison Chart; Author: Key Differences;https://www.youtube.com/watch?v=Ou2QGSJVd0U;License: Standard YouTube License, CC-BY
Correlation and Regression: Concepts with Illustrative examples; Author: LEARN & APPLY : Lean and Six Sigma;https://www.youtube.com/watch?v=xTpHD5WLuoA;License: Standard YouTube License, CC-BY


 Glencoe Algebra 1, Student Edition, 9780079039897...AlgebraISBN:9780079039897Author:CarterPublisher:McGraw Hill
 Calculus For The Life SciencesCalculusISBN:9780321964038Author:GREENWELL, Raymond N., RITCHEY, Nathan P., Lial, Margaret L.Publisher:Pearson Addison Wesley,
 Big Ideas Math A Bridge To Success Algebra 1: Stu...AlgebraISBN:9781680331141Author:HOUGHTON MIFFLIN HARCOURTPublisher:Houghton Mifflin Harcourt
 Holt Mcdougal Larson Pre-algebra: Student Edition...AlgebraISBN:9780547587776Author:HOLT MCDOUGALPublisher:HOLT MCDOUGAL
 Functions and Change: A Modeling Approach to Coll...AlgebraISBN:9781337111348Author:Bruce Crauder, Benny Evans, Alan NoellPublisher:Cengage Learning