
Concept explainers
Videos
a.
Find the expected value of change in biomass concentration associated with a 1-day increase in elapsed time.
a.
Answer to Problem 53CR
A one day increase in elapsed time will decrease the biomass concentration by
Explanation of Solution
Calculation:
It is given that y is the green biomass concentration
The simple linear equation is given as follows:
The above regression equation can be interpreted as, 1 unit increase of x will lead to decrease of 0.64 units in y, due to the negative slope of x.
Thus, 1 day increase in elapsed time will decrease the biomass concentration by
b.
Find the predicted value of biomass concentration if elapsed time is 40 days.
b.
Answer to Problem 53CR
The predicted value of biomass concentration for an elapsed time of 40 days is
Explanation of Solution
Calculation:
From Part (a), the regression equation is given by:
Substitute
Thus, the predicted value of biomass concentration for elapsed time of 40 days is
c.
Check whether there is a linear relationship between the two variables or not.
c.
Answer to Problem 53CR
There is convincing evidence of a useful linear relation between elapsed time and biomass concentration.
Explanation of Solution
Calculation:
It is given that the coefficient of determination
Denote
The null and alternative hypotheses are given by:
That is, there is no linear relationship between x and y.
That is, there is a linear relationship between x and y.
Assume that the level of significance for the test is
The test statistic for t–test when coefficient of determination is known is given by:
The quantity,
Here, the r value can be considered as negative, because the regression coefficient has negative value. Thus, the acceptable value of r is,
By substituting the values in the test statistic formula, one can get the value of test statistic.
That is,
Software procedure:
Step-by-step procedure to find the P-value using the MINITAB software:
- Choose Graph > Probability Distribution Plot.
- Choose View Probability > OK.
- From Distribution, choose ‘t’ distribution.
- Enter the Degrees of freedom as 56.
- Click the Shaded Area tab.
- Choose X Value and Both Tails for the region of the curve to shade.
- Enter the X value as –7.047.
- Click OK.
Output obtained using the MINITAB software is represented as follows:
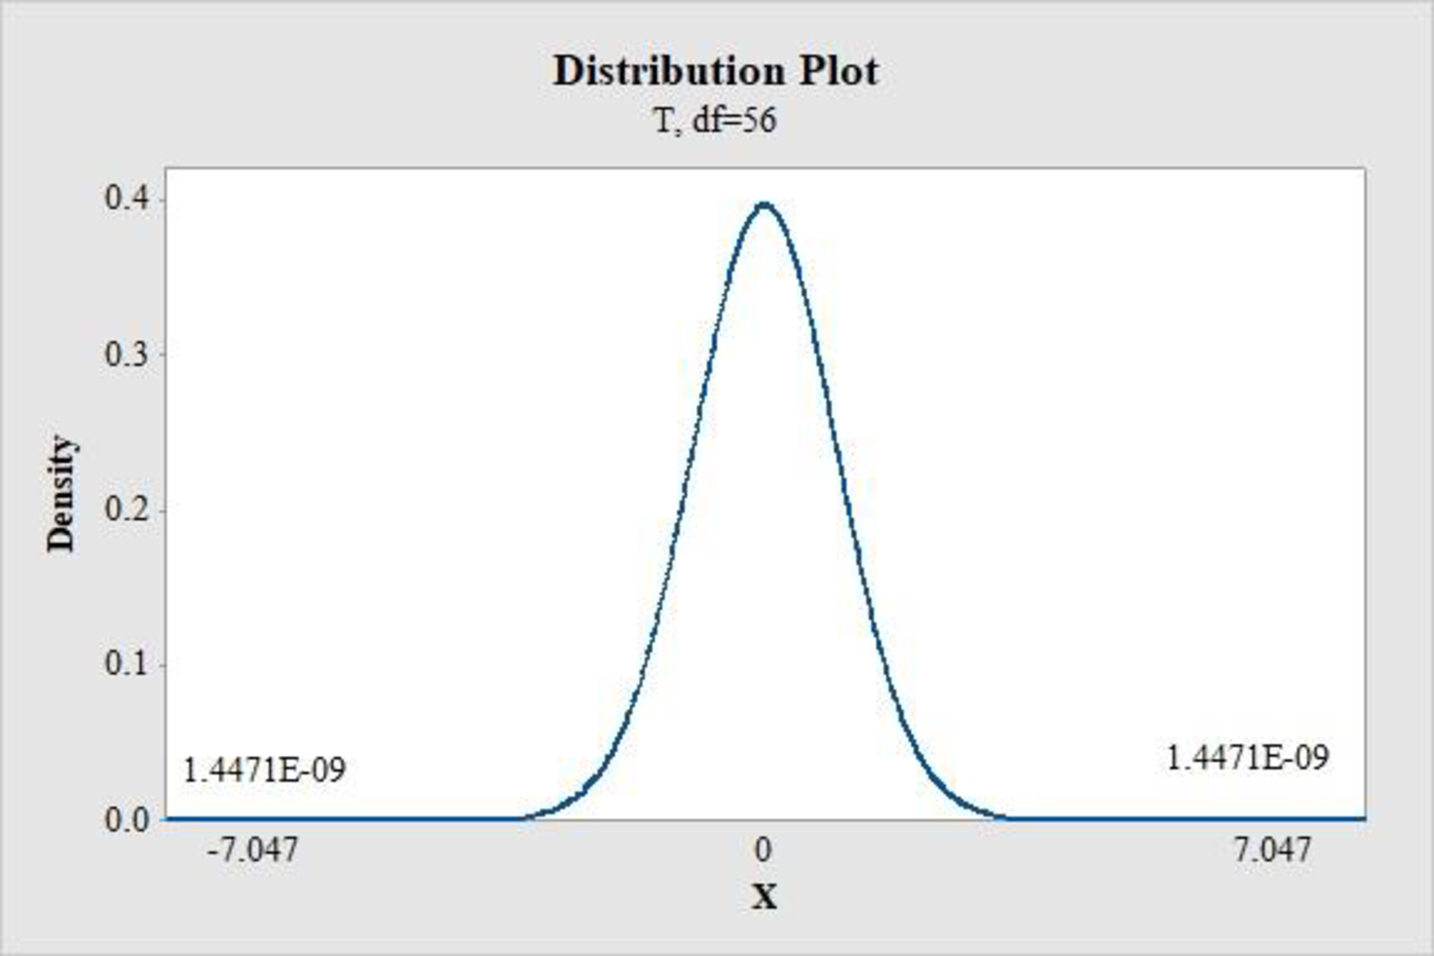
From the above graph, P-value is given by 1.4471E-09, which is approximately 0.
Decision rule:
Reject
Conclusion:
Here, the P-value is 0.
Therefore, the P-value is less than 0.05.
Hence reject
Thus, there is convincing evidence of a useful linear relation between elapsed time and biomass concentration.
Want to see more full solutions like this?
Chapter 13 Solutions
Introduction to Statistics and Data Analysis


- in the regression specification y =α+βx +δz +ε, the parameter α is calledarrow_forwardA fitted linear regression model is (y=10+2x ). If x = 0 and the corresponding observed value of y = 9, the residual at this observation is:arrow_forwardFit a multiple linear regression model to the given data. as X1,X2,X5, and X6 as regressors.arrow_forward
- The table contains data on vehicle speed (h) and fuel consumption (lt / 100km) of 5 randomly selected vehicles. Estimate the average fuel consumption of a vehicle traveling at 45 km / h using the simple linear regression equation between vehicle speed and fuel consumption. Speed 55 60 65 70 75 Consumption 13 12 11 10 9 a. 15 b. 8 c. 7 d. 20arrow_forwardShown below is a portion of a computer output for a linear regression analysis relating an individual's income (y in thousands of dollars) to age (x1 in years), level of education (x2 ranging from 1 to 5), and the individual's gender (x3 where 0 = female and 1 = male). Coefficient Standard Error t-statistic p-value Intercept 15.934 1.389 11.47 0.000 x1 0.625 0.094 6.65 0.000 x2 0.921 0.190 4.85 0.000 x3 –0.510 0.920 –0.55 0.590 Source of Variation Sum of squares Degrees of freedom Mean square F-statistic p-value Regression 84 3 28 4 0.027 Error 112 16 7 Total 196 19 a. Is there a significant relationship between an individual's income and the set of variables, age, level of education, and gender (based on a significance level α =05 )? Explain why using one of the p-values in the output tables. b.Which of the three predictor variables are…arrow_forwardThe following estimated regression model was developed relating yearly income (y in $1000s) of 30 individuals with their age (x1) and their gender (x2) (0 if male and 1 if female).ŷ = 30 + 0.7x1 + 3x2Also provided are SST = 1200 and SSE = 384.The yearly income of a 24-year-old female individual is _____.arrow_forward
- The table below contains the geographic latitudes, x, and average January temperatures, y, of 20 cities. Use Excel to find the best fit linear regression equation. Round the slope and intercept to two decimal places. x y46 2332 6039 4033 5938 5740 3342 3330 6434 5641 3936 4939 5447 2026 7645 2531 6239 4243 3137 5541 31 Answer: y=___x+___arrow_forwardThe table presents data on the taste test of 38 brands of pinot noir wine [data were first reported in an article by Kwan, Kowalski, and Skogenboe in the Journal Agricultural and Food Chemistry (1979, Vol. 27), the response variable is y = quality, and we want to find the "best" regression equation that relates quality to the other five parametersarrow_forwardIt is believed that the annual repair cost for the sporty automobile Jeep is related to its age. A sample of 11 automobiles revealed the results in the table at the right. Car age (xi) 2 3 1 7 5 8 1 2 6 9 4 Repair cost (yi) in £ 72 99 65 138 67 140 83 101 170 121 114 Define the terms regression and correlation analysis . From the simple linear model ,y= a + bx ,determine parameters a and barrow_forward
- The following table shows the annual number of PhD graduates in a country in various fields. NaturalSciences Engineering SocialSciences Education 1990 70 10 60 30 1995 130 40 100 50 2000 330 130 280 140 2005 490 370 460 210 2010 590 550 830 520 2012 690 590 1,000 900 (a) With x = the number of social science doctorates and y = the number of education doctorates, use technology to obtain the regression equation. (Round coefficients to three significant digits.) y(x) =arrow_forwardThe following are data on the average weekly profits(in $1,000) of five restaurants, their seating capacities, andthe average daily traffic (in thousands of cars) that passestheir locations: Seating Traffic Weekly netcapacity count profitx1 x2 y120 19 23.8200 8 24.2150 12 22.0180 15 26.2240 16 33.5 (a) Assuming that the regression is linear, estimate β0, β1,and β2.(b) Use the results of part (a) to predict the averageweekly net profit of a restaurant with a seating capacityof 210 at a location where the daily traffic count averages14,000 cars.arrow_forwardThe grades of a sample of 9 students on a prelim exam (x) and on the midterm exam (y) are shown in the excel worksheet. Find the regression equationarrow_forward
 Functions and Change: A Modeling Approach to Coll...AlgebraISBN:9781337111348Author:Bruce Crauder, Benny Evans, Alan NoellPublisher:Cengage Learning