
Concept explainers
Videos
a.
Find the regression equation.
Find the selling price of a home with an area of 2,200 square feet.
Construct a 95% confidence interval for all 2,200 square foot homes.
Construct a 95% prediction interval for the selling price of a home with 2,200 square feet.
a.
Answer to Problem 62DE
The regression equation is
The selling price of a home with an area of 2,200 square feet is $219,429.30.
The 95% confidence interval for all 2,200 square foot homes is
The 95% prediction interval for the selling price of a home with 2,200 square feet is
Explanation of Solution
Here, the selling price is the dependent variable and size of the home is the independent variable.
Step-by-step procedure to obtain the ‘regression equation’ using MegaStat software:
- In an EXCEL sheet enter the data values of x and y.
- Go to Add-Ins > MegaStat >
Correlation /Regression >Regression Analysis . - Select input
range as ‘Sheet1!$B$2:$B$106’ under Y/Dependent variable. - Select input range ‘Sheet1!$A$2:$A$106’ under X/Independent variables.
- Select ‘Type in predictor values’.
- Enter 2,200 as ‘predictor values’ and 95% as ‘confidence level’.
- Click on OK.
Output obtained using MegaStat software is given below:
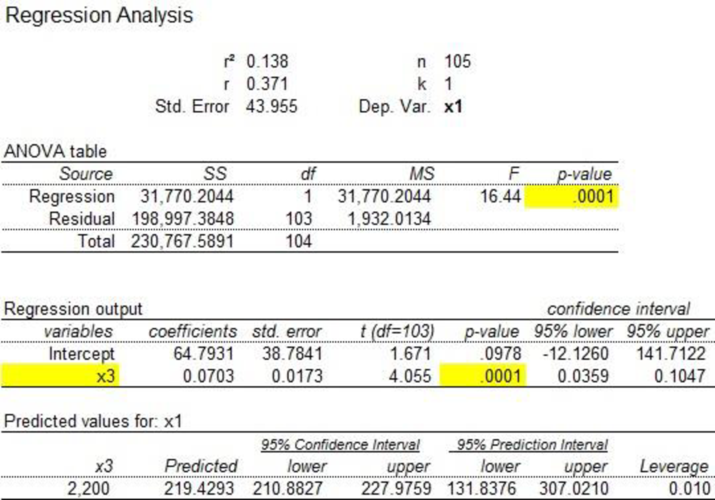
From the regression output, the regression equation is as follows.
Where y is the selling price and x is the size of the home.
The selling price of a home with an area of 2,200 square feet is $219,429.30.
The 95% confidence interval for all 2,200 square foot homes is
The 95% prediction interval for the selling price of a home with 2,200 square feet is
b.
Find the regression equation.
Find the selling price of a home with 20 miles from the center of the city.
Construct a 95% confidence interval for homes with 20 miles from the center of the city.
Construct a 95% prediction interval a home with 20 miles from the center of the city.
b.
Answer to Problem 62DE
The regression equation is
The estimated selling price of a home with 20 miles from the center of the city is $203087.10.
The 95% confidence interval for homes with 20 miles from the center of the city is
The 95% prediction interval for homes with 20 miles from the center of the city is
Explanation of Solution
Step-by-step procedure to obtain the ‘regression equation’ using MegaStat software:
- In an EXCEL sheet enter the data values of x and y.
- Go to Add-Ins > MegaStat > Correlation/Regression > Regression Analysis.
- Select input range as ‘Sheet1!$C$2:$C$106’ under Y/Dependent variable.
- Select input range ‘Sheet1!$B$2:$B$106’ under X/Independent variables.
- Select ‘Type in predictor values’.
- Enter 20 as ‘predictor values’ and 95% as ‘confidence level’.
- Click on OK.
Output obtained using MegaStat software is given below:

From the above output, the regression equation is as follows:
Where y is the selling price of a home and x is the distance from the center of the city.
The estimated selling price of a home with 20 miles from the center of the city is $203087.10.
The 95% confidence interval for homes with 20 miles from the center of the city is
The 95% prediction interval for a home with 20 miles from the center of the city is
c.
Check whether there is a
Check whether there is a
Report the p-value of the test and summarize the results.
c.
Answer to Problem 62DE
There is a negative association between “distance from the center of the city” and “selling price”.
There is a positive association between “selling price” and “area of the home”.
Explanation of Solution
Denote the population correlation as
The null and alternative hypotheses are stated below:
Null hypothesis:
That is, the correlation between “distance from the center of the city” and “selling price” is greater than or equal to zero.
Alternative hypothesis:
That is, the correlation between “distance from the center of the city” and “selling price” is less than zero.
Here, the sample size is 105 and the correlation coefficient between “distance from the center of the city” and “selling price” is –0.347.
The test statistic is as follows:
Thus, the test statistic value is –3.75.
The degrees of freedom is as follows:
The level of significance is 0.05. Therefore,
Critical value:
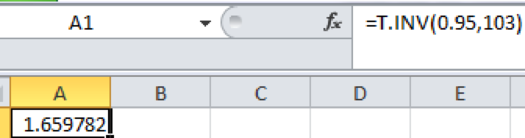
Step-by-step software procedure to obtain the critical value using EXCEL software:
- Open an EXCEL file.
- In cell A1, enter the formula “=T.INV (0.95, 103)”.
Output obtained using EXCEL is given as follows:
Decision rule:
Reject the null hypothesis H0, if
Conclusion:
The value of test statistic is –3.75 and the critical value is 1.659.
Here,
By the rejection rule, reject the null hypothesis.
Thus, it can be concluded that there is a negative association between“distance from the center of the city” and “selling price”.
Calculation of p-value:
Using excel formula = T.DIST (–3.75,103,TRUE)
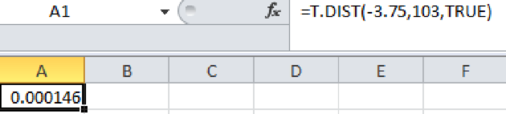
The p-value of the test is 0.000.
Check the correlation between independent variables “area of the home” and “selling price” is positive:
The hypotheses are given below:
Null hypothesis:
That is, the correlation between “size of the home” and “selling price” is less than or equal to zero.
Alternative hypothesis:
That is, the correlation between “size of the home” and “selling price” is positive.
Here, the sample size is 105 and the correlation coefficient is 0.371.
The test statistic is as follows:
Thus, the t-test statistic value is 3.76.
Conclusion:
The value of test statistic is 3.76 and the critical value is 1.659.
Here,
By the rejection rule, reject the null hypothesis.
Thus, it can be concluded that there is a positive association between “size of the home” and “selling price”.
Calculation of p-value:
Using excel formula = T.DIST (3.76,103,TRUE)
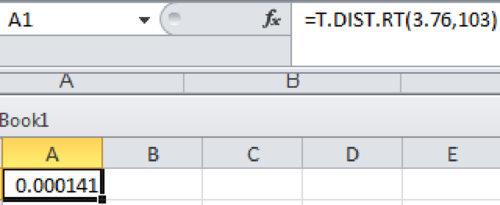
The p-value of the test is 0.000141.
Want to see more full solutions like this?
Chapter 13 Solutions
STAT TECHNIQUES IN BUSI 2370 >CI<


- Sarah is the office manager for a group of financial advisors who provide financial services forindividual clients. She would like to investigate whether a relationship exists between the numberof presentations made to prospective clients in a month and the number of new clients per month.The following table shows the number of presentations and corresponding new clients for aa random sample of six employees.Employee Presentations New Clients1 7 22 9 33 9 44 10 35 11 56 12 3Sarah would like to use simple regression analysis to estimate the number of new clients permonth based on the number of presentations made by the employee per month. The test statisticfor testing the hypothesis that the population coefficient of determination is greater than zero is________. A) 1.03 B) 1.45 C) -1.16 D) 0.35arrow_forwardThe following table shows, for eight vintages of select wine, purchases per buyer (y) and the wine buyer’s rating in a year (x): x 3.6 3.3 2.8 2.6 2.7 2.9 2.0 2.6 y 24 21 22 22 18 13 9 6 a. Estimate the regression of purchases per buyer on the buyer’s rating. b. Interpret the slope of the estimated regression line. c. Find and interpret the coefficient of determination.d. Find and interpret a 90% confidence interval for the slope of the population regression line. e. Find a 90% confidence interval for expected purchases per buyer for a vintage for which the buyer’s rating is 2.0.arrow_forwardIn simple linear regression, at what value of the independent variable, X, will the 95% confidence interval for the average value of Y be narrowest? At what value will the 95% prediction interval for the value of Y for a single n ew observation be narrowest?arrow_forward
- The final exam score was recorded for each Harper statistics student in a sample of 30. A 95% confidence interval forarrow_forwardSuppose you estimated the relationship between the exam scores and class sizes. score^ = b0 + b1*Size + e^ Based on the OLS estimate, you obtain the following standard errors and parameter estimates: b0= 95; se(b0) = 30 ; b1= −1.2; se(b1 ) = 0.4 ; n = 25 a) What kind of relationship exist between the exam scores and the clas sizes? Interpret the regression. b) Conduct the following hypothesis test at the 1% significance level: H0 : b1 ≥ 0 H1 : b1 < 0 In your answer draw the distribution of the test statistic that you use, and clearly define the rejection region(s), indicating the critical value(s).arrow_forwardThe director of marketing at Vanguard Corporation believes that sales of the company's Bright Side laundry detergent (S) are related to Vanguard's own advertising expenditures (A), as well as the combined advertising expenditures of its three biggest rival detergents (R).The marketing director collects 36 weekly observations on S, A, and R . Vanguard's marketing director is comfortable using parameter estimates that are statistically significant at the 10 percent level or better. Give the specific statistical tool that can be used to this problem.arrow_forward
- The following table lists the monthly incomes (in hundreds of dollars) and the monthly rents paid (in hundreds of dollars) by a sample of six families. Monthly Income Monthly Rent 24 7.0 16 4.5 19 6.5 31 11.6 10 4.5 27 8.5 1.The 99% confidence interval for the slope, B, of the population regression line is (2 decimals): __________________________________________ 2. The null hypothesis is that the slope of the population regression line of monthly rent on monthly income is zero and the alternative hypothesis is that the slope of this population regression line is greater than zero. The significance level is 1%. What is the critical value of t (3 decimals)? __________________________________________ 3. The null hypothesis is that the slope of the population regression line of monthly rent on monthly income is zero and the alternative hypothesis is that the slope of this population regression line is greater than zero. The significance level is 1%. What is…arrow_forwardConsider the following set of dependent and independent variables. Use these data to answer questions a and b in the photos below. y 47 44 40 40 27 21 19 15 9 x1 22 32 18 19 10 18 8 15 9 x2 71 60 81 55 42 46 32 17 16 a) construct a 95% confidence interval for the regression coefficient for x1 and interpret its meaning. -the 95% confidence interval for the true population b1 is ___ to ___. b) Construxt a 95% confidence interval for the regression coefficient for x2 and interpret its meaning. -the 95% confidence interval for the true population coefficient b2 is ___ to ___. Please help!!arrow_forwardfind the value: t a2and n = 15 for the 98% confidence interval for the mean. t a2and n= 20 for the 95% confidence interval for the mean.arrow_forward
- In a situation where the sample size was decreased from 39 to 29 in a normally distributed data set, what would be the impact on the confidence interval?arrow_forwardIf a treatment is expected to decrease scores on a variable for which the mean is expected to be u=50,What is the null hypothesis?arrow_forwardA medical researcher treats 400 subjects with high cholesterol using a new drug. After two months of taking the drug, the average decrease in cholesterol level is = 90 and the researcher assumes that the decrease in cholesterol follows a Normal distribution, with unknown mean and standard deviation = 20. A 95% confidence interval for is: a. 90 ± 2.94. b. 90 ± 2.35. c. 90 ± 1.96. d. 90 ± 3.92arrow_forward
 Glencoe Algebra 1, Student Edition, 9780079039897...AlgebraISBN:9780079039897Author:CarterPublisher:McGraw Hill
 Big Ideas Math A Bridge To Success Algebra 1: Stu...AlgebraISBN:9781680331141Author:HOUGHTON MIFFLIN HARCOURTPublisher:Houghton Mifflin Harcourt