Elementary Statistics-Package
12th Edition
ISBN: 9780321942975
Author: Triola
Publisher: PEARSON
expand_more
expand_more
format_list_bulleted
Videos
Textbook Question
Chapter 13, Problem 6RE
Using Nonparametric Tests. In Exercises 1–10, use a 0.05 significance level with the indicated test. If no particular test is specified, use the appropriate nonparametric test from this chapter.
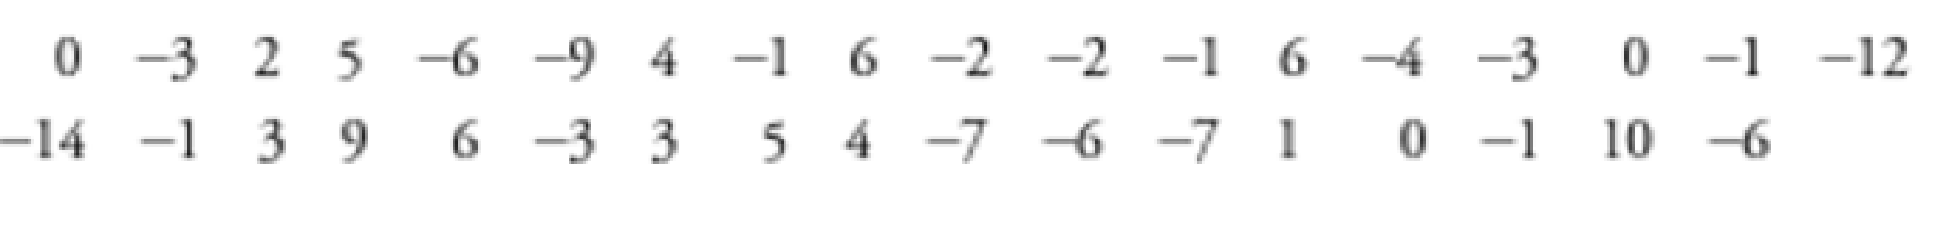
6. Accuracy of Weather Forecasts The author conducted a study of the accuracy of weather forecasts by recording the actual high temperatures along with the high temperatures that were forecast 5 days earlier. Differences (actual minus forecast) for 35 clays arc listed below. Use a 0.05 significance level with the sign test to test the claim that the population of differences has a median of zero. What do the results suggest about the accuracy of the forecasts?
Expert Solution & Answer
Want to see the full answer?
Check out a sample textbook solution
Students have asked these similar questions
When is it inappropriate to use observations in social science research? Select one.
Question 8 options:
When you are observing private or confidential activities
When you are obtaining information from infants, children, animals, or anyone who cannot speak or answer questions accurately
When the data should be more reliable than from interviews or questionnaires
When you need to use the information to form a hypothesis
In a statistical test, we have a choice of a left-tailed test, a right-tailed test, or a two-tailed test. Is it the null hypothesis or the alternate hypothesis that determines which type of test is used? Explain your answer.
The alternative hypothesis because it specifies what the level of significance of the test will be.
The null hypothesis because it specifies what the level of significance of the test will be.
The null hypothesis because it specifies the region of interest for the parameter in question.
The alternative hypothesis because it specifies the region of interest for the parameter in question.
RAW DATA (Scores on GEOL Test)
48, 41,39, 27, 44, 44, 47, 31, 40, 50, 44, 47, 50, 42, 51, 22, 19, 40, 44, 34
median =
mode =
Chapter 13 Solutions
Elementary Statistics-Package
Ch. 13.2 - Prob. 1BSCCh. 13.2 - Prob. 2BSCCh. 13.2 - Prob. 3BSCCh. 13.2 - Prob. 4BSCCh. 13.2 - Prob. 5BSCCh. 13.2 - Prob. 6BSCCh. 13.2 - Prob. 7BSCCh. 13.2 - Prob. 8BSCCh. 13.2 - Prob. 9BSCCh. 13.2 - Prob. 10BSC
Ch. 13.2 - In Exercises 9-12, use the sign test for the data...Ch. 13.2 - Prob. 12BSCCh. 13.2 - Prob. 13BSCCh. 13.2 - In Exercises 13-16, use the sign test for the...Ch. 13.2 - Prob. 15BSCCh. 13.2 - In Exercises 13-16, use the sign test for the...Ch. 13.2 - Appendix B Data Sets.In Exercises 13-16, refer to...Ch. 13.2 - Prob. 18BSCCh. 13.2 - Appendix B Data Sets.In Exercises 17-20, refer to...Ch. 13.2 - Appendix B Data Sets.In Exercises 17-20, refer to...Ch. 13.2 - Procedures for Handling Ties In the sign test...Ch. 13.2 - Prob. 22BBCh. 13.3 - Wilcoxon Signed-Ranks Test for Freshman 15 The...Ch. 13.3 - Prob. 2BSCCh. 13.3 - Prob. 3BSCCh. 13.3 - Prob. 4BSCCh. 13.3 - Prob. 5BSCCh. 13.3 - Prob. 6BSCCh. 13.3 - Using the Wilcoxon Signed-Ranks Test.In Exercises...Ch. 13.3 - Prob. 8BSCCh. 13.3 - Prob. 9BSCCh. 13.3 - Prob. 10BSCCh. 13.3 - Appendix B Data Sets.In Exercises 9-12, refer to...Ch. 13.3 - Prob. 12BSCCh. 13.3 - Prob. 13BBCh. 13.4 - Prob. 1BSCCh. 13.4 - Prob. 2BSCCh. 13.4 - Prob. 3BSCCh. 13.4 - Prob. 4BSCCh. 13.4 - Prob. 5BSCCh. 13.4 - Prob. 6BSCCh. 13.4 - Prob. 7BSCCh. 13.4 - Prob. 8BSCCh. 13.4 - Prob. 9BSCCh. 13.4 - Prob. 10BSCCh. 13.4 - Prob. 11BSCCh. 13.4 - Prob. 12BSCCh. 13.4 - Prob. 13BBCh. 13.4 - Prob. 14BBCh. 13.5 - Effect of Lead on IQ Score Listed below are full...Ch. 13.5 - Prob. 2BSCCh. 13.5 - Notation For the data given in Exercise 1,...Ch. 13.5 - Prob. 4BSCCh. 13.5 - Prob. 5BSCCh. 13.5 - Prob. 6BSCCh. 13.5 - Prob. 7BSCCh. 13.5 - Using tho Kruskal-Wallis Test.In Exercises 5-8,...Ch. 13.5 - Prob. 9BSCCh. 13.5 - Prob. 10BSCCh. 13.5 - Prob. 11BSCCh. 13.5 - Car Crash Measurements Refer to Data See 13 in...Ch. 13.5 - Prob. 13BBCh. 13.6 - Regression If the methods of this section arc used...Ch. 13.6 - Level of Measurement Which of the levels of...Ch. 13.6 - Prob. 3BSCCh. 13.6 - Prob. 4BSCCh. 13.6 - Prob. 5BSCCh. 13.6 - Prob. 6BSCCh. 13.6 - Prob. 7BSCCh. 13.6 - Testing for Rank Correlation. In Exercises 7-12,...Ch. 13.6 - Prob. 9BSCCh. 13.6 - Testing for Rank Correlation. In Exercises 7-12,...Ch. 13.6 - Prob. 11BSCCh. 13.6 - Prob. 12BSCCh. 13.6 - Appendix B Data Sets. In Exercises 13-16, use the...Ch. 13.6 - Prob. 14BSCCh. 13.6 - Appendix B Data Sets. In Exercises 13-16, use the...Ch. 13.6 - Prob. 16BSCCh. 13.6 - Prob. 17BBCh. 13.7 - Prob. 1BSCCh. 13.7 - Prob. 2BSCCh. 13.7 - Prob. 3BSCCh. 13.7 - Prob. 4BSCCh. 13.7 - Prob. 5BSCCh. 13.7 - Prob. 6BSCCh. 13.7 - Prob. 7BSCCh. 13.7 - Prob. 8BSCCh. 13.7 - Prob. 9BSCCh. 13.7 - Baseball World Series Victories Test the claim...Ch. 13.7 - Prob. 11BSCCh. 13.7 - Prob. 12BSCCh. 13 - Prob. 1CQQCh. 13 - Prob. 2CQQCh. 13 - Prob. 3CQQCh. 13 - Prob. 4CQQCh. 13 - Prob. 5CQQCh. 13 - Prob. 6CQQCh. 13 - Prob. 7CQQCh. 13 - Prob. 8CQQCh. 13 - Prob. 9CQQCh. 13 - Sign Test Identify three different applications of...Ch. 13 - Prob. 1RECh. 13 - Prob. 2RECh. 13 - Prob. 3RECh. 13 - Prob. 4RECh. 13 - Prob. 5RECh. 13 - Using Nonparametric Tests. In Exercises 110, use a...Ch. 13 - Prob. 7RECh. 13 - Prob. 8RECh. 13 - Prob. 9RECh. 13 - Prob. 10RECh. 13 - Prob. 1CRECh. 13 - Please be aware that some of the following...Ch. 13 - Prob. 3CRECh. 13 - Prob. 4CRECh. 13 - Prob. 5CRECh. 13 - Prob. 6CRECh. 13 - Prob. 7CRECh. 13 - Prob. 8CRECh. 13 - Prob. 9CRECh. 13 - Prob. 10CRECh. 13 - Prob. 11TPCh. 13 - Prob. 10FDD
Knowledge Booster


Learn more about
Need a deep-dive on the concept behind this application? Look no further. Learn more about this topic, statistics and related others by exploring similar questions and additional content below.Similar questions
- The accuracy of a coin-counter machine is gauged to accept nickels with a mean diameter of millimeters 21.21 mm. A sample of 42 nickles was drawn from a reported defective coin-counter machine located near a school. The sample had a sample mean of 21.214 mm and sample standard deviation 0.01 mm. Test the claim that the mean nickel diameter accepted by this coin-counter machine is greater than 21.21 mm. Test at the 0.1 significance level. (a) Identify the correct alternative hypothesis H a H a : μ < 21.21 μ < 21.21 μ = 21.21 μ = 21.21 μ > 21.21 μ > 21.21 Give all answers correct to 4 decimal places. (b) The test statistic value is: (c) Using the Traditional method, the critical value is: (d) Based on your answers above, do you: Fail to reject H 0 H 0 Reject H 0 H 0 (e) Explain your choice in the box below. (f) Based on your work above, choose one of the following conclusions of your test: There is not sufficient evidence to support…arrow_forwardA consulting firm advises on sampling and statistical procedures that can be used by their clients to control their manufacturing processes. A sample of a dimension existing 800 data points was collected from the process during a time that it was operating successfully. The sample standard deviation was .21 and since the number of samples was so large this was considered to be the population standard deviation. The consulting firm then suggested that data be collected in groups of 30 to periodically monitor and correct the process. The design specification was determined to be 12. The hypothesis test suggested by the consulting firm was: Ho: μ = 12 H1: μ ≠ 12 Corrective action will be taken whenever Ho is rejected. Sample 1 Sample 2 Sample 3 11.55 11.62 11.91…arrow_forwardThe speed of light is measured 25 times by a new procedure. The 25 measurements are recorded, and show no trend or pattern. The investigators work out the average and SD of the 25 measurements; the average is 299,789.2 kilometers per second and the SD is 12 kilometers per second. (Assume the Gauss model, with no bias.) It is assumed that all units are kilometers per second. Find an approximate 95%-confidence interval for the speed of light. Enter numeric answers for the lower and upper endpoints of the interval here; be sure to show your work. (a) The 95% confidence interval for the speed of light is to . (b) Now the investigators measure the speed of light a 26th time by the same procedure, and get 299,781 kilometers per second. Is this a surprising result? Answer yes or no, and explain your reason.arrow_forward
- Park officials make predictions of times to the next eruption of a particular geyser, and collect data for the errors (minutes) in those predictions. The display from technology available below results from using the prediction errors to test the claim that the mean prediction error is equal to zero. Comment on the accuracy of the predictions. Use a 0.05 significance level. Identify the null and alternative hypotheses, Identify the test statistic, Identify the P-value, State the final conclusion that addresses the original claim. Comment on the accuracy of the predictionsarrow_forward1. a. You want to estimate the mean hourly yield for a process that manufactures an antibiotic. You observe the process for 50 hourly periods chosen at random, with the results ?̅= 31 ounces per hour and ? = 3. Estimate the mean hourly yield for the process using a 90% and 95% confidence interval. no 2 di fotoarrow_forwardDoritos chips are one of the most popular chips in the year 2020. Frito-Lay produces snack-sized bags of Doritos with 1.75-ounce bags. Unfortunately, Frito-Lay has received many complaints that the bags of chips lack the promised amount of chips. PepsiCo, the owner of Frito-Lay, decide to run an internal investigation of their Doritos chip production. They sample around 500 bags of chips to discover that they found an average of 1.59 ounces with a standard deviation of .12 ounces. Conduct a hypothesis test with an alpha-level of .05. Should they change their production of Doritos chips to match the 1.75 ounces on the bag?arrow_forward
- (Please do not give solution in image format thanku) 1. The national average for SAT mathematics scores is 500 with a standard deviation of 110. The Board of Education for a local school district is concerned that the mean SAT math score from their district is significantly lower than the national average. Given that the mean SAT mathematics score for a random sample of 100 local freshmen is 464, is there reason to believe that the Board of Education's concerns are justified? Use an appropriate test of hypothesis to address this concern.arrow_forwardQuestion- "A random sample of 130 human body temperatures has a mean of 98.25◦ F and a standard deviation of 0.73◦ F. A researcher believes that the commonly reported mean body temperature of 98.6◦ F is wrong. In this problem, you will conduct a hypothesis t-test to test the researchers claim and determine if the given data indicates that the average human body temperature is different from 98.6◦ F." Need help with- formulate null hypothesis and alternative hypothesis to test if the average human body temperature is different from 98.6◦ Farrow_forwardThe accuracy of a coin-counter machine is gauged to accept nickels with a mean diameter of millimeters 21.21 mm. A sample of 38 nickles was drawn from a reported defective coin-counter machine located near a school. The sample had a sample mean of 21.214 mm and sample standard deviation 0.01 mm.Test the claim that the mean nickel diameter accepted by this coin-counter machine is greater than 21.21 mm. Test at the 0.1 significance level.(a) Identify the correct alternative hypothesis HaHa: μ=21.21μ=21.21 μ>21.21μ>21.21 μ<21.21μ<21.21 Give all answers correct to 4 decimal places.(b) The test statistic value is: (c) Using the Traditional method, the critical value is:arrow_forward
- Lecture(10.3a): Identify the test statistic used for the ANOVA procedure and how it is calculated. (a) The test statistic is F and is calculated by finding the difference between groups.arrow_forwardWhich statement is TRUE? Estimation is a procedure where a numerical value or values are assigned to the population parameter based on the information collected from a sample. Estimation is a procedure where numerical value or values are assigned to the sample statistic based on the information collected from a sample.arrow_forwardAn IQ test is designed so that the mean is 100 and the standard deviation is 17 for the population of normal adults. Find the sample size necessary to estimate the mean IQ score of statistics students such that it can be said with 90% confidence that the sample mean is within 4 IQ points of the true mean. Assume that σ=17 and determine the required sample size using technology. Then determine if this is a reasonable sample size for a real world calculation. Question content area bottom Part 1 The required sample size is 4949. (Round up to the nearest integer.) Part 2 Would it be reasonable to sample this number of students? No. This number of IQ test scores is a fairly large number. Yes. This number of IQ test scores is a fairly small number. No. This number of IQ test scores is a fairly small number. Yes. This number of IQ test scores is a fairly large number.arrow_forward
arrow_back_ios
SEE MORE QUESTIONS
arrow_forward_ios
Recommended textbooks for you
 MATLAB: An Introduction with ApplicationsStatisticsISBN:9781119256830Author:Amos GilatPublisher:John Wiley & Sons Inc
 Probability and Statistics for Engineering and th...StatisticsISBN:9781305251809Author:Jay L. DevorePublisher:Cengage Learning
 Statistics for The Behavioral Sciences (MindTap C...StatisticsISBN:9781305504912Author:Frederick J Gravetter, Larry B. WallnauPublisher:Cengage Learning
 Elementary Statistics: Picturing the World (7th E...StatisticsISBN:9780134683416Author:Ron Larson, Betsy FarberPublisher:PEARSON
 The Basic Practice of StatisticsStatisticsISBN:9781319042578Author:David S. Moore, William I. Notz, Michael A. FlignerPublisher:W. H. Freeman
 Introduction to the Practice of StatisticsStatisticsISBN:9781319013387Author:David S. Moore, George P. McCabe, Bruce A. CraigPublisher:W. H. Freeman
MATLAB: An Introduction with Applications
Statistics
ISBN:9781119256830
Author:Amos Gilat
Publisher:John Wiley & Sons Inc
Probability and Statistics for Engineering and th...
Statistics
ISBN:9781305251809
Author:Jay L. Devore
Publisher:Cengage Learning
Statistics for The Behavioral Sciences (MindTap C...
Statistics
ISBN:9781305504912
Author:Frederick J Gravetter, Larry B. Wallnau
Publisher:Cengage Learning
Elementary Statistics: Picturing the World (7th E...
Statistics
ISBN:9780134683416
Author:Ron Larson, Betsy Farber
Publisher:PEARSON
The Basic Practice of Statistics
Statistics
ISBN:9781319042578
Author:David S. Moore, William I. Notz, Michael A. Fligner
Publisher:W. H. Freeman
Introduction to the Practice of Statistics
Statistics
ISBN:9781319013387
Author:David S. Moore, George P. McCabe, Bruce A. Craig
Publisher:W. H. Freeman
Hypothesis Testing using Confidence Interval Approach; Author: BUM2413 Applied Statistics UMP;https://www.youtube.com/watch?v=Hq1l3e9pLyY;License: Standard YouTube License, CC-BY
Hypothesis Testing - Difference of Two Means - Student's -Distribution & Normal Distribution; Author: The Organic Chemistry Tutor;https://www.youtube.com/watch?v=UcZwyzwWU7o;License: Standard Youtube License