A curve connecting points of equal atmospheric pressure on a weather map is called an isobar . On a typical weather map the isobars refer to pressure at mean sea level and are given in units of millibars (mb). Mathematically, isobars are level curves for the pressure function p x , y defined at the geographic points x , y represented on the map. Tightly packed isobars correspond to steep slopes on the graph of the pressure function, and these are usually associated with strong winds—the steeper the slope, the greater the speed of the wind. (a) Referring to the accompanying weather map, is the wind speed greater in Medicine Hat, Alberta or in Chicago? Explain your reasoning. (b) Estimate the average rate of change in atmospheric pressure (in mb/mi) from Medicine Hat to Chicago. given that the distance between the two cities is approximately 1400 mi.
A curve connecting points of equal atmospheric pressure on a weather map is called an isobar . On a typical weather map the isobars refer to pressure at mean sea level and are given in units of millibars (mb). Mathematically, isobars are level curves for the pressure function p x , y defined at the geographic points x , y represented on the map. Tightly packed isobars correspond to steep slopes on the graph of the pressure function, and these are usually associated with strong winds—the steeper the slope, the greater the speed of the wind. (a) Referring to the accompanying weather map, is the wind speed greater in Medicine Hat, Alberta or in Chicago? Explain your reasoning. (b) Estimate the average rate of change in atmospheric pressure (in mb/mi) from Medicine Hat to Chicago. given that the distance between the two cities is approximately 1400 mi.
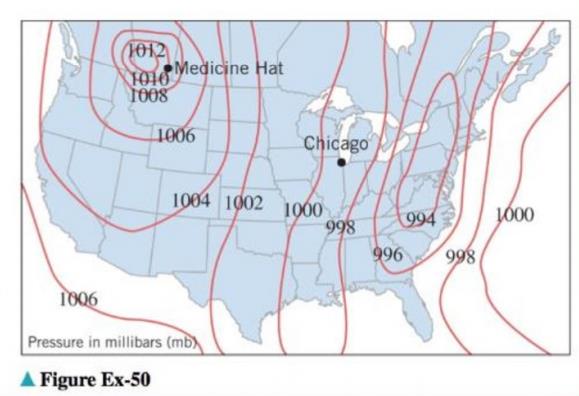
A curve connecting points of equal atmospheric pressure on a weather map is called an isobar. On a typical weather map the isobars refer to pressure at mean sea level and are given in units of millibars (mb). Mathematically, isobars are level curves for the pressure function
p
x
,
y
defined at the geographic points
x
,
y
represented on the map. Tightly packed isobars correspond to steep slopes on the graph of the pressure function, and these are usually associated with strong winds—the steeper the slope, the greater the speed of the wind.
(a) Referring to the accompanying weather map, is the wind speed greater in Medicine Hat, Alberta or in Chicago? Explain your reasoning.
(b) Estimate the average rate of change in atmospheric pressure (in mb/mi) from Medicine Hat to Chicago. given that the distance between the two cities is approximately 1400 mi.
Calculus, Single Variable: Early Transcendentals (3rd Edition)
Knowledge Booster
Learn more about
Need a deep-dive on the concept behind this application? Look no further. Learn more about this topic, calculus and related others by exploring similar questions and additional content below.


 Algebra & Trigonometry with Analytic GeometryAlgebraISBN:9781133382119Author:SwokowskiPublisher:Cengage