Concept explainers
Videos
If a gas is cooled with its volume held constant, then it follows from the ideal gas law in physics that its pressure drops proportionally to the drop in temperature. The temperature that, in theory, corresponds to a pressure of zero is called absolute zero. Suppose that an experiment produces the following data for pressure P versus temperature T with the volume held constant:
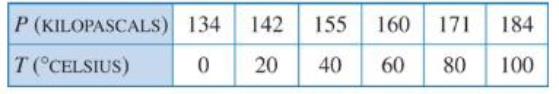
(a) Use a calculating utility to find the regression line of P as a function of T.
(b) Use a graphing utility to make a graph that shows the data points and the regression line.
(c) Use the regression line to estimate the value of absolute zero in degrees Celsius.
Want to see the full answer?
Check out a sample textbook solution
Chapter 13 Solutions
Calculus Early Transcendentals, Binder Ready Version
Additional Math Textbook Solutions
Calculus: Single And Multivariable
Calculus and Its Applications (11th Edition)
Glencoe Math Accelerated, Student Edition
Precalculus: Mathematics for Calculus (Standalone Book)
Calculus: Early Transcendentals (3rd Edition)


- bThe average rate of change of the linear function f(x)=3x+5 between any two points is ________.arrow_forwardThe following fictitious table shows kryptonite price, in dollar per gram, t years after 2006. t= Years since 2006 0 1 2 3 4 5 6 7 8 9 10 K= Price 56 51 50 55 58 52 45 43 44 48 51 Make a quartic model of these data. Round the regression parameters to two decimal places.arrow_forwardOlympic Pole Vault The graph in Figure 7 indicates that in recent years the winning Olympic men’s pole vault height has fallen below the value predicted by the regression line in Example 2. This might have occurred because when the pole vault was a new event there was much room for improvement in vaulters’ performances, whereas now even the best training can produce only incremental advances. Let’s see whether concentrating on more recent results gives a better predictor of future records. (a) Use the data in Table 2 (page 176) to complete the table of winning pole vault heights shown in the margin. (Note that we are using x=0 to correspond to the year 1972, where this restricted data set begins.) (b) Find the regression line for the data in part ‚(a). (c) Plot the data and the regression line on the same axes. Does the regression line seem to provide a good model for the data? (d) What does the regression line predict as the winning pole vault height for the 2012 Olympics? Compare this predicted value to the actual 2012 winning height of 5.97 m, as described on page 177. Has this new regression line provided a better prediction than the line in Example 2?arrow_forward
 College AlgebraAlgebraISBN:9781305115545Author:James Stewart, Lothar Redlin, Saleem WatsonPublisher:Cengage Learning
 Linear Algebra: A Modern IntroductionAlgebraISBN:9781285463247Author:David PoolePublisher:Cengage Learning
 Functions and Change: A Modeling Approach to Coll...AlgebraISBN:9781337111348Author:Bruce Crauder, Benny Evans, Alan NoellPublisher:Cengage Learning
 Algebra and Trigonometry (MindTap Course List)AlgebraISBN:9781305071742Author:James Stewart, Lothar Redlin, Saleem WatsonPublisher:Cengage Learning
 Algebra & Trigonometry with Analytic GeometryAlgebraISBN:9781133382119Author:SwokowskiPublisher:Cengage