Statistics: The Art and Science of Learning from Data (4th Edition)
4th Edition
ISBN: 9780321997838
Author: Alan Agresti, Christine A. Franklin, Bernhard Klingenberg
Publisher: PEARSON
bartleby

Concept explainers

bartleby

Videos

Textbook Question
Book Icon
Chapter 13.2, Problem 12PB

Predicting sports attendance Keeneland Racetrack in Lexington, Kentucky, has been a social gathering place since 1935. Every spring and fall thousands of people come to the racetrack to socialize, gamble, and enjoy the horse races that have become so popular in Kentucky. A study investigated the different factors that affect the attendance at Keeneland. To many people, the social aspect of Keeneland is just as important as watching the races, if not more. The study investigates which factors significantly contribute to attendance by Keeneland visitors. (Source: Data from Gatton School of Business and Economics publication, Gatton College, 2009.)

ANOVA table for y = attendance at Keeneland

Chapter 13.2, Problem 12PB, Predicting sports attendance Keeneland Racetrack in Lexington, Kentucky, has been a social gathering

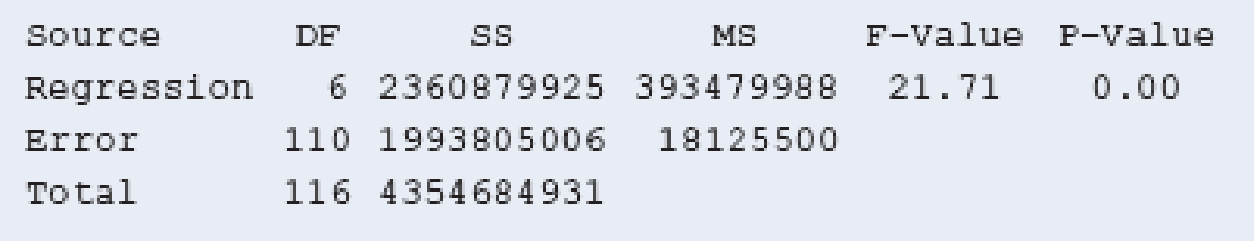
  1. a. Show how R2 is calculated from the SS values and report its value.
  2. b. Interpret the R2 value. Does the multiple regression equation help us predict the attendance much better than we could without knowing that equation?
  3. c. Find the multiple correlation. Interpret.
Blurred answer

Chapter 13 Solutions

Statistics: The Art and Science of Learning from Data (4th Edition)

Ch. 13.1 - Used cars The following data (also available from...Ch. 13.2 - Predicting sports attendance Keeneland Racetrack...Ch. 13.2 - Predicting weight Lets use multiple regression to...Ch. 13.2 - Prob. 14PBCh. 13.2 - Price of used cars For the 19 used cars listed in...Ch. 13.2 - Prob. 16PBCh. 13.2 - Softball data For the Softball data set on the...Ch. 13.2 - Slopes, correlations, and units In Example 2 on y...Ch. 13.2 - Predicting college GPA Using software with the...Ch. 13.3 - Predicting GPA For the 59 observations in the...Ch. 13.3 - Study time help GPA? Refer to the previous...Ch. 13.3 - Variability in college GPA Refer to the previous...Ch. 13.3 - Does leg press help predict body strength? Chapter...Ch. 13.3 - Prob. 24PBCh. 13.3 - Interpret strength variability Refer to the...Ch. 13.3 - Any predictive power? Refer to the previous three...Ch. 13.3 - Predicting pizza revenue Aunt Ermas Pizza...Ch. 13.3 - Prob. 28PBCh. 13.3 - Mental health again Refer to the previous...Ch. 13.3 - Prob. 30PBCh. 13.3 - House prices Use software to do further analyses...Ch. 13.4 - Body weight residuals Examples 47 used multiple...Ch. 13.4 - Strength residuals In Chapter 12, we analyzed...Ch. 13.4 - Prob. 34PBCh. 13.4 - Nonlinear effects of age Suppose you fit a...Ch. 13.4 - Prob. 36PBCh. 13.4 - Why inspect residuals? When we use multiple...Ch. 13.4 - College athletes The College Athletes data set on...Ch. 13.4 - House prices Use software with the House Selling...Ch. 13.4 - Prob. 40PBCh. 13.5 - U.S. and foreign used cars Refer to the used car...Ch. 13.5 - Prob. 42PBCh. 13.5 - Predict using house size and condition For the...Ch. 13.5 - Quality and productivity The table shows data from...Ch. 13.5 - Predicting hamburger sales A chain restaurant that...Ch. 13.5 - Prob. 46PBCh. 13.5 - House size and garage interact? Refer to the...Ch. 13.5 - Prob. 48PBCh. 13.5 - Comparing sales You own a gift shop that has a...Ch. 13.6 - Prob. 50PBCh. 13.6 - Prob. 51PBCh. 13.6 - Prob. 52PBCh. 13.6 - Prob. 53PBCh. 13.6 - Prob. 54PBCh. 13.6 - Prob. 55PBCh. 13.6 - Prob. 56PBCh. 13.6 - Prob. 57PBCh. 13.6 - Prob. 58PBCh. 13.6 - Prob. 59PBCh. 13 - House prices This chapter has considered many...Ch. 13 - Prob. 61CPCh. 13 - Prob. 62CPCh. 13 - Prob. 63CPCh. 13 - Prob. 64CPCh. 13 - Prob. 65CPCh. 13 - Prob. 66CPCh. 13 - Prob. 67CPCh. 13 - Prob. 68CPCh. 13 - Prob. 69CPCh. 13 - AIDS and AZT In a study (reported in the New York...Ch. 13 - Factors affecting first home purchase The table...Ch. 13 - Unemployment and GDP Refer to Exercise 13.67. When...Ch. 13 - Prob. 75CPCh. 13 - Prob. 76CPCh. 13 - Prob. 77CPCh. 13 - Prob. 78CPCh. 13 - Prob. 79CPCh. 13 - True or false: Slopes For data on y = college GPA,...Ch. 13 - Prob. 81CPCh. 13 - Lurking variable Give an example of three...Ch. 13 - Prob. 83CPCh. 13 - Prob. 84CPCh. 13 - Prob. 85CPCh. 13 - Logistic versus linear For binary response...Ch. 13 - Prob. 87CPCh. 13 - Prob. 88CPCh. 13 - Prob. 89CPCh. 13 - Prob. 90CPCh. 13 - Prob. 91CPCh. 13 - Prob. 92CPCh. 13 - Prob. 93CP
Knowledge Booster
Background pattern image
Statistics
Learn more about
Need a deep-dive on the concept behind this application? Look no further. Learn more about this topic, statistics and related others by exploring similar questions and additional content below.
Similar questions
Recommended textbooks for you
Text book image
Functions and Change: A Modeling Approach to Coll...
Algebra
ISBN:9781337111348
Author:Bruce Crauder, Benny Evans, Alan Noell
Publisher:Cengage Learning
Text book image
Holt Mcdougal Larson Pre-algebra: Student Edition...
Algebra
ISBN:9780547587776
Author:HOLT MCDOUGAL
Publisher:HOLT MCDOUGAL
Text book image
Big Ideas Math A Bridge To Success Algebra 1: Stu...
Algebra
ISBN:9781680331141
Author:HOUGHTON MIFFLIN HARCOURT
Publisher:Houghton Mifflin Harcourt
Sampling Methods and Bias with Surveys: Crash Course Statistics #10; Author: CrashCourse;https://www.youtube.com/watch?v=Rf-fIpB4D50;License: Standard YouTube License, CC-BY
Statistics: Sampling Methods; Author: Mathispower4u;https://www.youtube.com/watch?v=s6ApdTvgvOs;License: Standard YouTube License, CC-BY