
Concept explainers
Videos
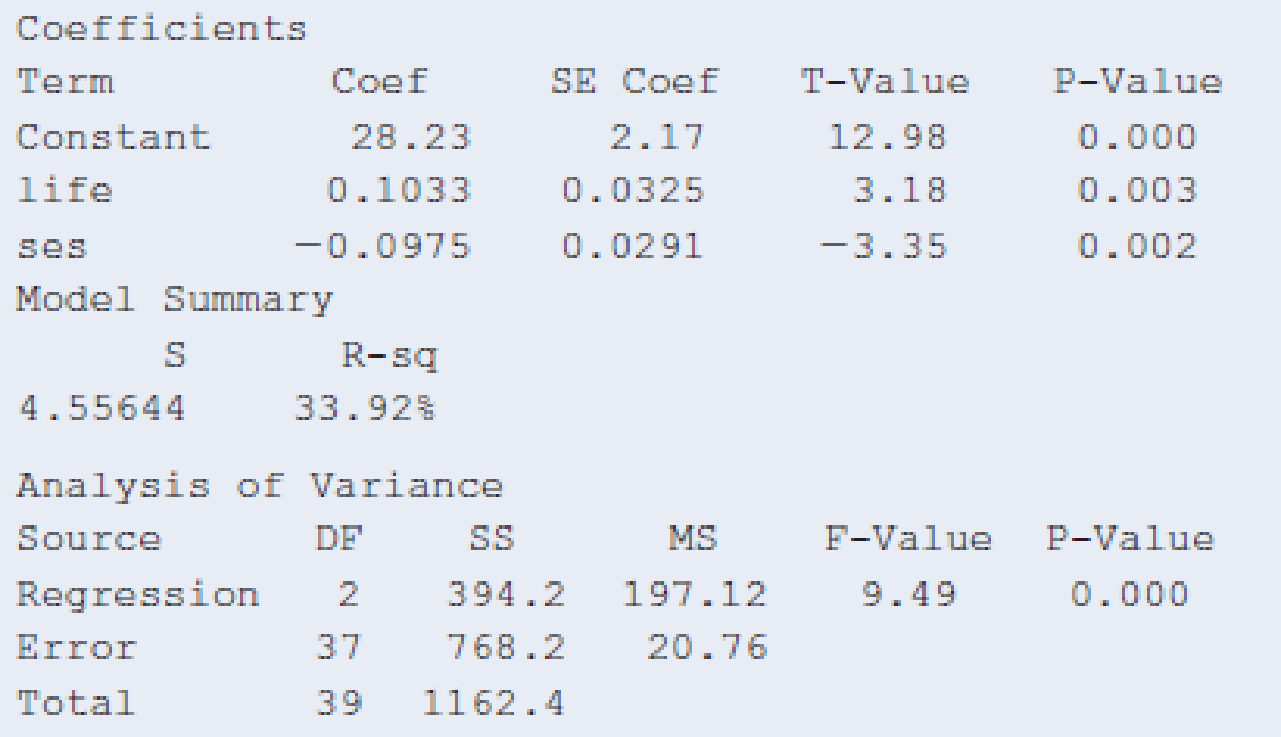
Mental health again Refer to the previous exercise.
- a. Report the test statistic and P-value for testing H0: β1 = β2 = 0.
- b. State the alternative hypothesis that is supported by the result in part a.
- c. Does the result in part a imply that necessarily both life events and SES are needed in the model? Explain.
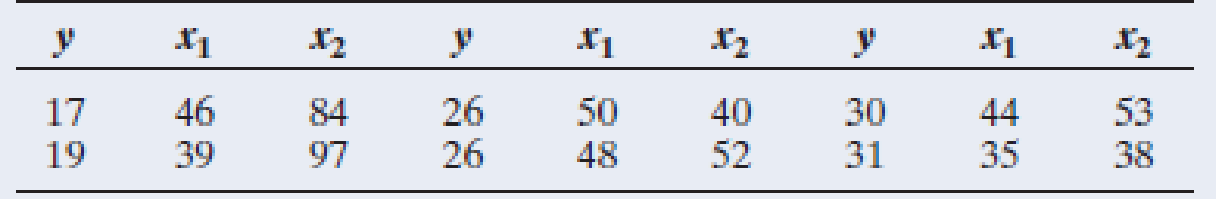
13.28 Regression for mental health A study in Alachua County, Florida, investigated an index of mental health impairment, which had
- a. Find the 95% confidence interval for β1.
- b. Explain why the interval in part a means that an increase of 100 units in life events corresponds to anywhere from a 4- to 17-unit increase in mean mental impairment, controlling for SES. (This lack of precision reflects the small sample size.)
y = mental impairment, x1 = life events index, and x2 = socioeconomic status
Want to see the full answer?
Check out a sample textbook solution
Chapter 13 Solutions
Statistics: The Art and Science of Learning from Data (4th Edition)


- Life Expectancy The following table shows the average life expectancy, in years, of a child born in the given year42 Life expectancy 2005 77.6 2007 78.1 2009 78.5 2011 78.7 2013 78.8 a. Find the equation of the regression line, and explain the meaning of its slope. b. Plot the data points and the regression line. c. Explain in practical terms the meaning of the slope of the regression line. d. Based on the trend of the regression line, what do you predict as the life expectancy of a child born in 2019? e. Based on the trend of the regression line, what do you predict as the life expectancy of a child born in 1580?2300arrow_forwardX Y 5 10 3 6 6 7 4 3 2 4 a. Compute the Pearson correlation. b. Find the regression equation for predicting Y from X. c. Calculate SSresidualarrow_forward5) The following results are from data where the dependent variable is SALARY, the independent variables are AGE, EDUCATION, and FEMALE which is a dummy variable = 1 for females and = 0 for males. e) What is the null and alternative hypothesis that Excel is testing in reporting the t-stats above? f) Is the regression equation as a whole significant at the 1% level of significance? How do you know? g) What is the effect on the income of a person being a female versus male? h) Is there a significant amount of evidence (say at the 10% level of significance) that an additional year of education increases income by more than $2000? Be sure to state your null and alternative hypotheses, calculate your test statistic, and find the critical value.arrow_forward
- 1)Write the regression equation that represents the above equation. Y = 9.804326378 + 0.65795*X1 + 0.200358 X2 Height of an individual = 9.8043 + 0.6579*Mother's Height + 0.2004* Father's Height 2)Is this a good predictor equation? Why or why not (use appropriate statistics/hypothesis test to prove your point)?arrow_forwardThe Pearson correlation between X1 and Y is r = 0.40. When a second variable, X2, is added to the regression equation, we obtain R2 = 0.64. How much variance for the Y scores is predicted by using both X1 and X2 as predictor variables? 0.40 or 40% 0.64 or 64% 0.48 or 48% 0.16 or 16%arrow_forward5) The following results are from data where the dependent variable is SALARY, the independent variables are AGE, EDUCATION, and FEMALE which is a dummy variable = 1 for females and = 0 for males. b) How much of the variation in income is explained by the regressors? c) What is the standard error of the error term in the regression equation? d) Are any of the explanatory (independent) variables significant at the 10% level of significance? How do you know?arrow_forward
- Management proposed the following regression model to predict sales at a fast-food outlet. y = ?0 + ?1x1 + ?2x2 + ?3x3 + ? where x1 = number of competitors within one mile x2 = population within one mile (1,000s) x3 = 1 if drive-up window present 0 otherwise y = sales ($1,000s). The following estimated regression equation was developed after 20 outlets were surveyed. ŷ = 10.5 − 4.2x1 + 6.8x2 + 15.5x3 (a) What is the expected amount of sales (in dollars) attributable to the drive-up window? $ (b) Predict sales (in dollars) for a store with two competitors within one mile, a population of 8,000 within one mile, and no drive-up window. $ (c) Predict sales (in dollars) for a store with one competitor within one mile, a population of 3,000 within one mile, and a drive-up window. $arrow_forward11) Adding a predictor to a regression model causes which of the following changes?a) SSError decreases and SSRegression increases.b) SSError increases and SSRegression decreases.c) Both SSError and SSRegression decrease.d) Both SSError and SSRegression increase.arrow_forward1. Consider the following data table of x- and y-values, where x is predictor variable and y is the response variable. - Image of table is attached 1a. Write the regression equation corresponding to the give data table. 1b. Use the regression equation obtained in part (4) to predict the value of y for x = 9.5.arrow_forward
- I’m interested in seeing whether or not there is a relationship between the number of hours someone sleeps and traffic accidents. I gather data from the Department of Transportation and get the following data: X (hours of sleep) Y (Traffic accidents) 5 2 5 1 3 4 4 4 2 6 6 3 8 1 9 1 5 0 6 4 Using the above data, create a linear regression equation to predict traffic accidents from hours of sleep. What is the Pearson correlation coefficient? Is it strong or weak? Positive or negative? What is the linear regression equation? (in the form of Y’ = bX + a) How many traffic accidents might we predict with someone that gets 0 hours of sleep? How many traffic accidents might we predict with someone that gets 11 hours of sleep?arrow_forward6) The following results are from data where the dependent variable is EXPENSE FEES, the independent variables are SAFETY RATING, PERFORMANCE, and LOAD which is a dummy variable = 1 for load funds and = 0 for no-load funds. d) What is the standard error of the error term in the regression equation? e) Are any of the explanatory (independent) variables significant at the 10% level of significance? How do you know? f) What is the null and alternative hypothesis that Excel is testing in reporting the t-stats above?arrow_forwardA study investigating the relationship between level x of fertilizer application and crop yield y on 25 one-acre test plots produced r = 0.79, r2 = 0.62, se = 0.97, and the regression equation y-hat = 652x + 311. 1) For the level of fertilizer application 0.38 units, the mean crop yield is predicted to be about what? 2) The proportion of the variability in yield that is accounted for by the level of fertilization is about what?arrow_forward
 Functions and Change: A Modeling Approach to Coll...AlgebraISBN:9781337111348Author:Bruce Crauder, Benny Evans, Alan NoellPublisher:Cengage Learning
 Glencoe Algebra 1, Student Edition, 9780079039897...AlgebraISBN:9780079039897Author:CarterPublisher:McGraw Hill