Statistics: The Art and Science of Learning from Data (4th Edition)
4th Edition
ISBN: 9780321997838
Author: Alan Agresti, Christine A. Franklin, Bernhard Klingenberg
Publisher: PEARSON
bartleby

Concept explainers

bartleby

Videos

Textbook Question
Book Icon
Chapter 13.4, Problem 38PB

College athletes The College Athletes data set on the book’s website comes from a study of University of Georgia female athletes. Using the column names from the data set, the response variable 1RM = maximum bench press has explanatory variables LBM = lean body mass (which is weight times 1 minus the proportion of body fat) and REPS70 = number of repetitions before fatigue with a 70-pound bench press. Let’s look at all the steps of a regression analysis for these data.

  1. a. The first figure shows a 
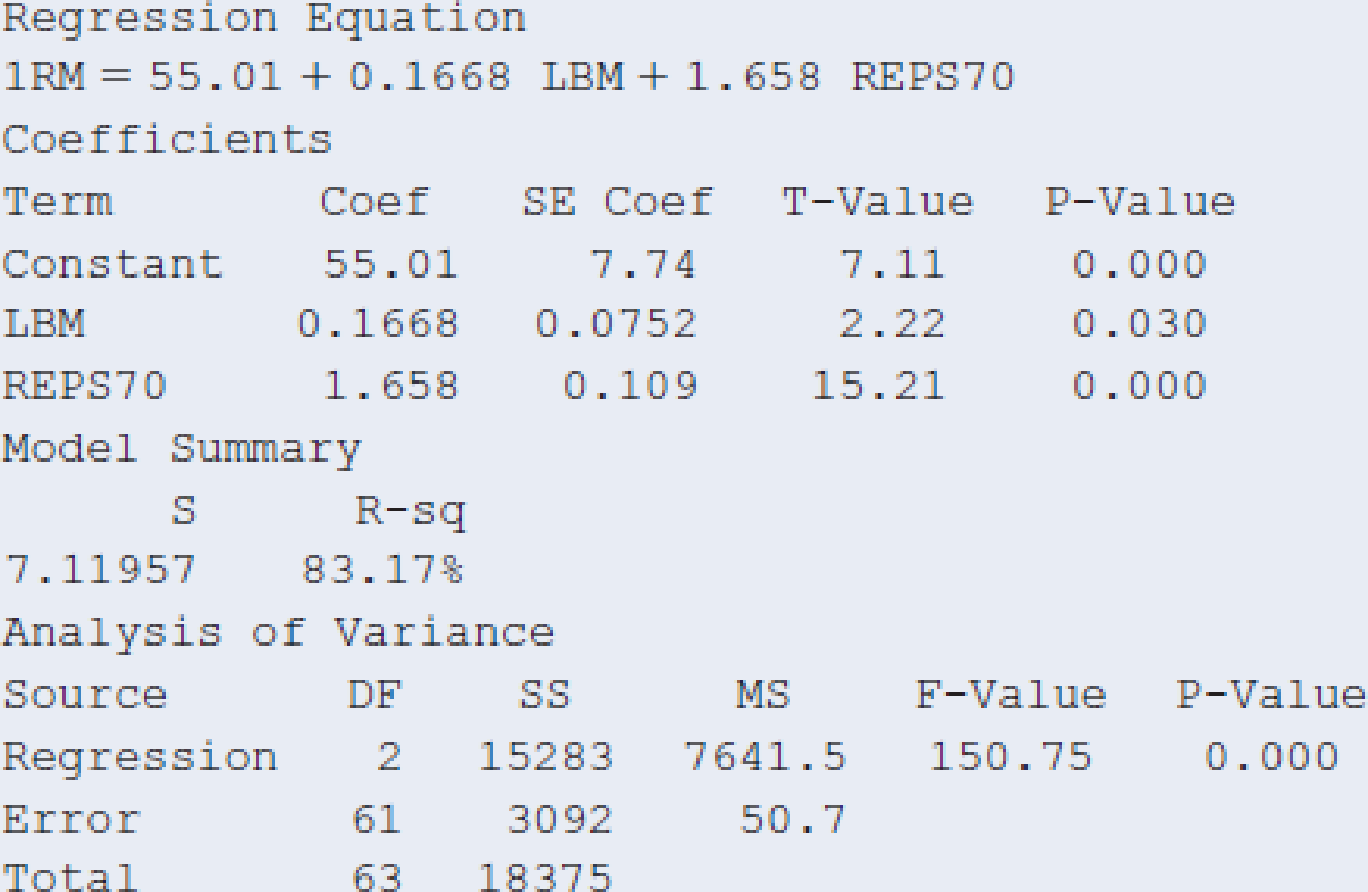
scatterplot matrix. Which two plots in the figure describe the associations with 1RM as a response variable? Describe those associations.
  2. b. Results of a multiple regression analysis are shown. Write down the prediction equation and interpret the coefficient of REPS70.
  3. c. Report R2 and interpret its value in the context of these variables.
  4. d. Based on the value of R2, report and interpret the multiple correlation.
  5. e. Interpret results of the F test that 1RM is independent of these two predictors. Show how to obtain the F statistic from the mean squares in the ANOVA table.
  6. f. Once REPS70 is in the model, does it help to have LBM as a second predictor? Answer by showing all steps of a significance test for a regression parameter.
  7. g. Examine the histogram shown of the residuals for the multiple regression model. What does this describe, and what does it suggest?
  8. h. Examine the plot shown of the residuals plotted against values of REPS70. What does this describe, and what does it suggest?
  9. i. From the plot in part h, can you identify a subject whose 1RM value was considerably lower than expected based on the predictor values? Identify by indicating the approximate values of REPS70 and the standardized residual for that subject.

Chapter 13.4, Problem 38PB, College athletes The College Athletes data set on the books website comes from a study of University , example  1

Chapter 13.4, Problem 38PB, College athletes The College Athletes data set on the books website comes from a study of University , example  2

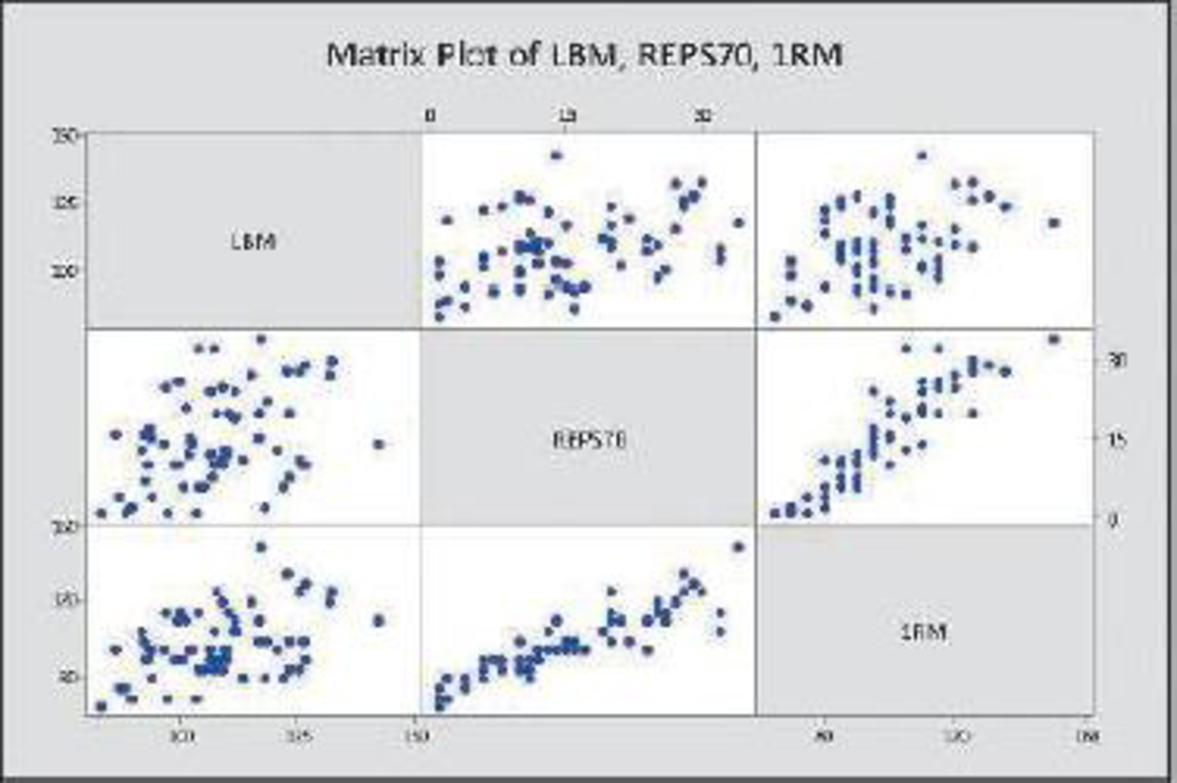
Scatterplot matrix for Exercise 13.38.

Chapter 13.4, Problem 38PB, College athletes The College Athletes data set on the books website comes from a study of University , example  3

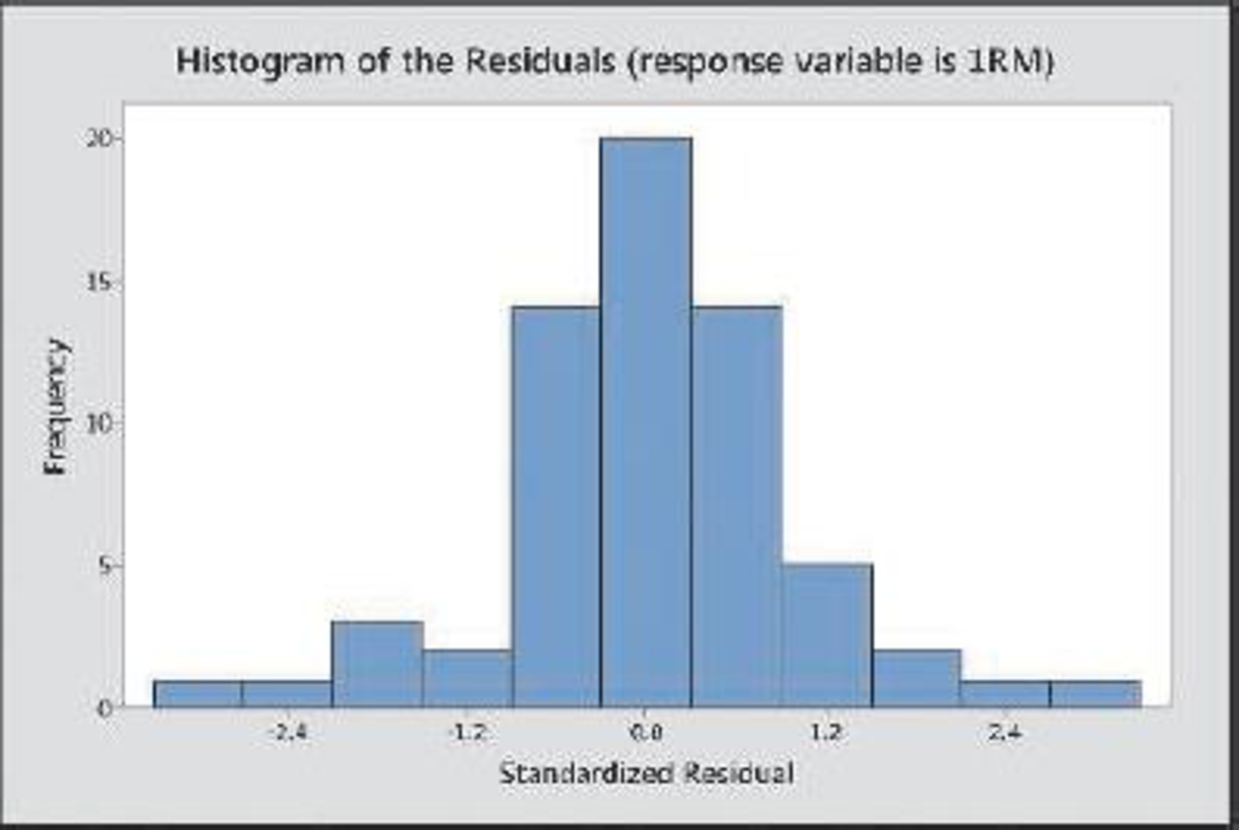
Residual plot for Exercise 13.38, part g.

Chapter 13.4, Problem 38PB, College athletes The College Athletes data set on the books website comes from a study of University , example  4

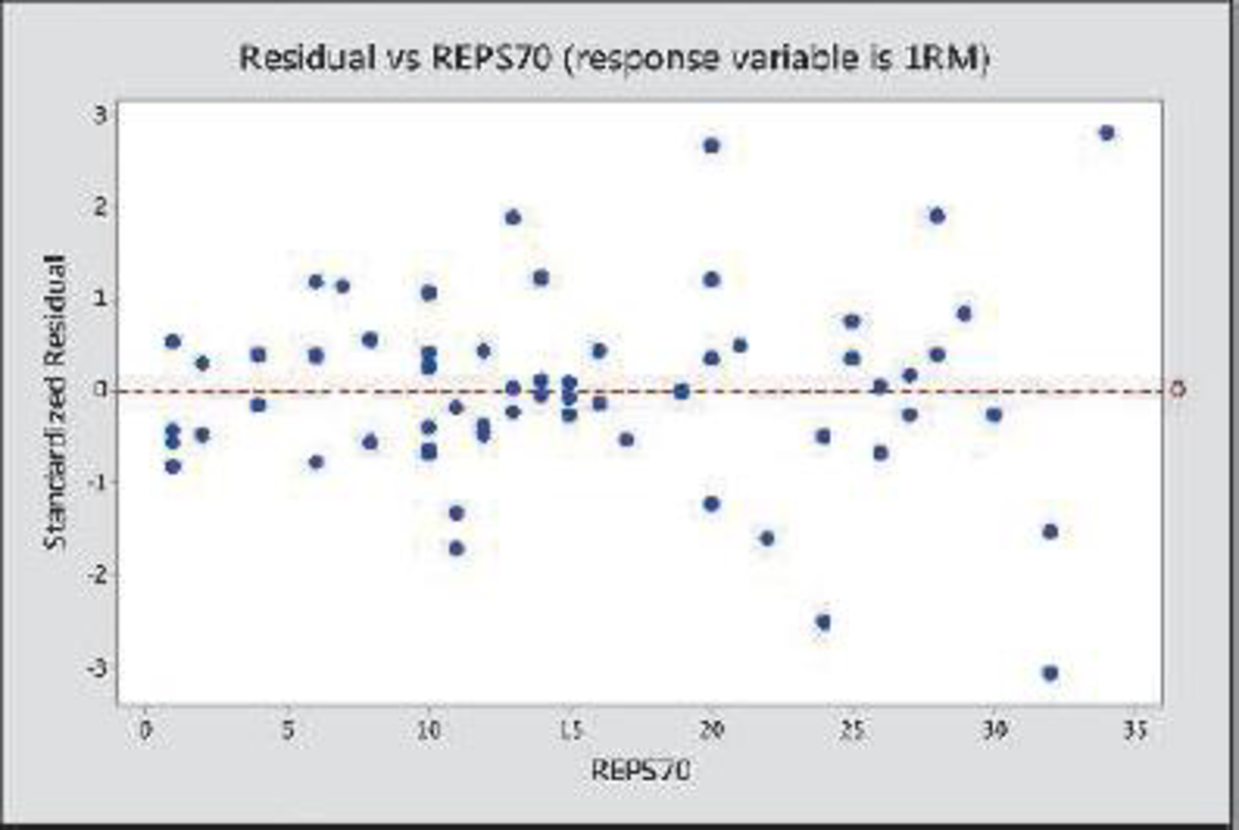
Residual plot for Exercise 13.38, part h.

Blurred answer
02:34

Chapter 13 Solutions

Statistics: The Art and Science of Learning from Data (4th Edition)

Ch. 13.1 - Used cars The following data (also available from...Ch. 13.2 - Predicting sports attendance Keeneland Racetrack...Ch. 13.2 - Predicting weight Lets use multiple regression to...Ch. 13.2 - Prob. 14PBCh. 13.2 - Price of used cars For the 19 used cars listed in...Ch. 13.2 - Prob. 16PBCh. 13.2 - Softball data For the Softball data set on the...Ch. 13.2 - Slopes, correlations, and units In Example 2 on y...Ch. 13.2 - Predicting college GPA Using software with the...Ch. 13.3 - Predicting GPA For the 59 observations in the...Ch. 13.3 - Study time help GPA? Refer to the previous...Ch. 13.3 - Variability in college GPA Refer to the previous...Ch. 13.3 - Does leg press help predict body strength? Chapter...Ch. 13.3 - Prob. 24PBCh. 13.3 - Interpret strength variability Refer to the...Ch. 13.3 - Any predictive power? Refer to the previous three...Ch. 13.3 - Predicting pizza revenue Aunt Ermas Pizza...Ch. 13.3 - Prob. 28PBCh. 13.3 - Mental health again Refer to the previous...Ch. 13.3 - Prob. 30PBCh. 13.3 - House prices Use software to do further analyses...Ch. 13.4 - Body weight residuals Examples 47 used multiple...Ch. 13.4 - Strength residuals In Chapter 12, we analyzed...Ch. 13.4 - Prob. 34PBCh. 13.4 - Nonlinear effects of age Suppose you fit a...Ch. 13.4 - Prob. 36PBCh. 13.4 - Why inspect residuals? When we use multiple...Ch. 13.4 - College athletes The College Athletes data set on...Ch. 13.4 - House prices Use software with the House Selling...Ch. 13.4 - Prob. 40PBCh. 13.5 - U.S. and foreign used cars Refer to the used car...Ch. 13.5 - Prob. 42PBCh. 13.5 - Predict using house size and condition For the...Ch. 13.5 - Quality and productivity The table shows data from...Ch. 13.5 - Predicting hamburger sales A chain restaurant that...Ch. 13.5 - Prob. 46PBCh. 13.5 - House size and garage interact? Refer to the...Ch. 13.5 - Prob. 48PBCh. 13.5 - Comparing sales You own a gift shop that has a...Ch. 13.6 - Prob. 50PBCh. 13.6 - Prob. 51PBCh. 13.6 - Prob. 52PBCh. 13.6 - Prob. 53PBCh. 13.6 - Prob. 54PBCh. 13.6 - Prob. 55PBCh. 13.6 - Prob. 56PBCh. 13.6 - Prob. 57PBCh. 13.6 - Prob. 58PBCh. 13.6 - Prob. 59PBCh. 13 - House prices This chapter has considered many...Ch. 13 - Prob. 61CPCh. 13 - Prob. 62CPCh. 13 - Prob. 63CPCh. 13 - Prob. 64CPCh. 13 - Prob. 65CPCh. 13 - Prob. 66CPCh. 13 - Prob. 67CPCh. 13 - Prob. 68CPCh. 13 - Prob. 69CPCh. 13 - AIDS and AZT In a study (reported in the New York...Ch. 13 - Factors affecting first home purchase The table...Ch. 13 - Unemployment and GDP Refer to Exercise 13.67. When...Ch. 13 - Prob. 75CPCh. 13 - Prob. 76CPCh. 13 - Prob. 77CPCh. 13 - Prob. 78CPCh. 13 - Prob. 79CPCh. 13 - True or false: Slopes For data on y = college GPA,...Ch. 13 - Prob. 81CPCh. 13 - Lurking variable Give an example of three...Ch. 13 - Prob. 83CPCh. 13 - Prob. 84CPCh. 13 - Prob. 85CPCh. 13 - Logistic versus linear For binary response...Ch. 13 - Prob. 87CPCh. 13 - Prob. 88CPCh. 13 - Prob. 89CPCh. 13 - Prob. 90CPCh. 13 - Prob. 91CPCh. 13 - Prob. 92CPCh. 13 - Prob. 93CP
Knowledge Booster
Background pattern image
Statistics
Learn more about
Need a deep-dive on the concept behind this application? Look no further. Learn more about this topic, statistics and related others by exploring similar questions and additional content below.
Recommended textbooks for you
Text book image
Functions and Change: A Modeling Approach to Coll...
Algebra
ISBN:9781337111348
Author:Bruce Crauder, Benny Evans, Alan Noell
Publisher:Cengage Learning
Text book image
Elementary Linear Algebra (MindTap Course List)
Algebra
ISBN:9781305658004
Author:Ron Larson
Publisher:Cengage Learning
Text book image
Algebra and Trigonometry (MindTap Course List)
Algebra
ISBN:9781305071742
Author:James Stewart, Lothar Redlin, Saleem Watson
Publisher:Cengage Learning
Text book image
College Algebra
Algebra
ISBN:9781337282291
Author:Ron Larson
Publisher:Cengage Learning
Text book image
Glencoe Algebra 1, Student Edition, 9780079039897...
Algebra
ISBN:9780079039897
Author:Carter
Publisher:McGraw Hill
Correlation Vs Regression: Difference Between them with definition & Comparison Chart; Author: Key Differences;https://www.youtube.com/watch?v=Ou2QGSJVd0U;License: Standard YouTube License, CC-BY
Correlation and Regression: Concepts with Illustrative examples; Author: LEARN & APPLY : Lean and Six Sigma;https://www.youtube.com/watch?v=xTpHD5WLuoA;License: Standard YouTube License, CC-BY