
Videos
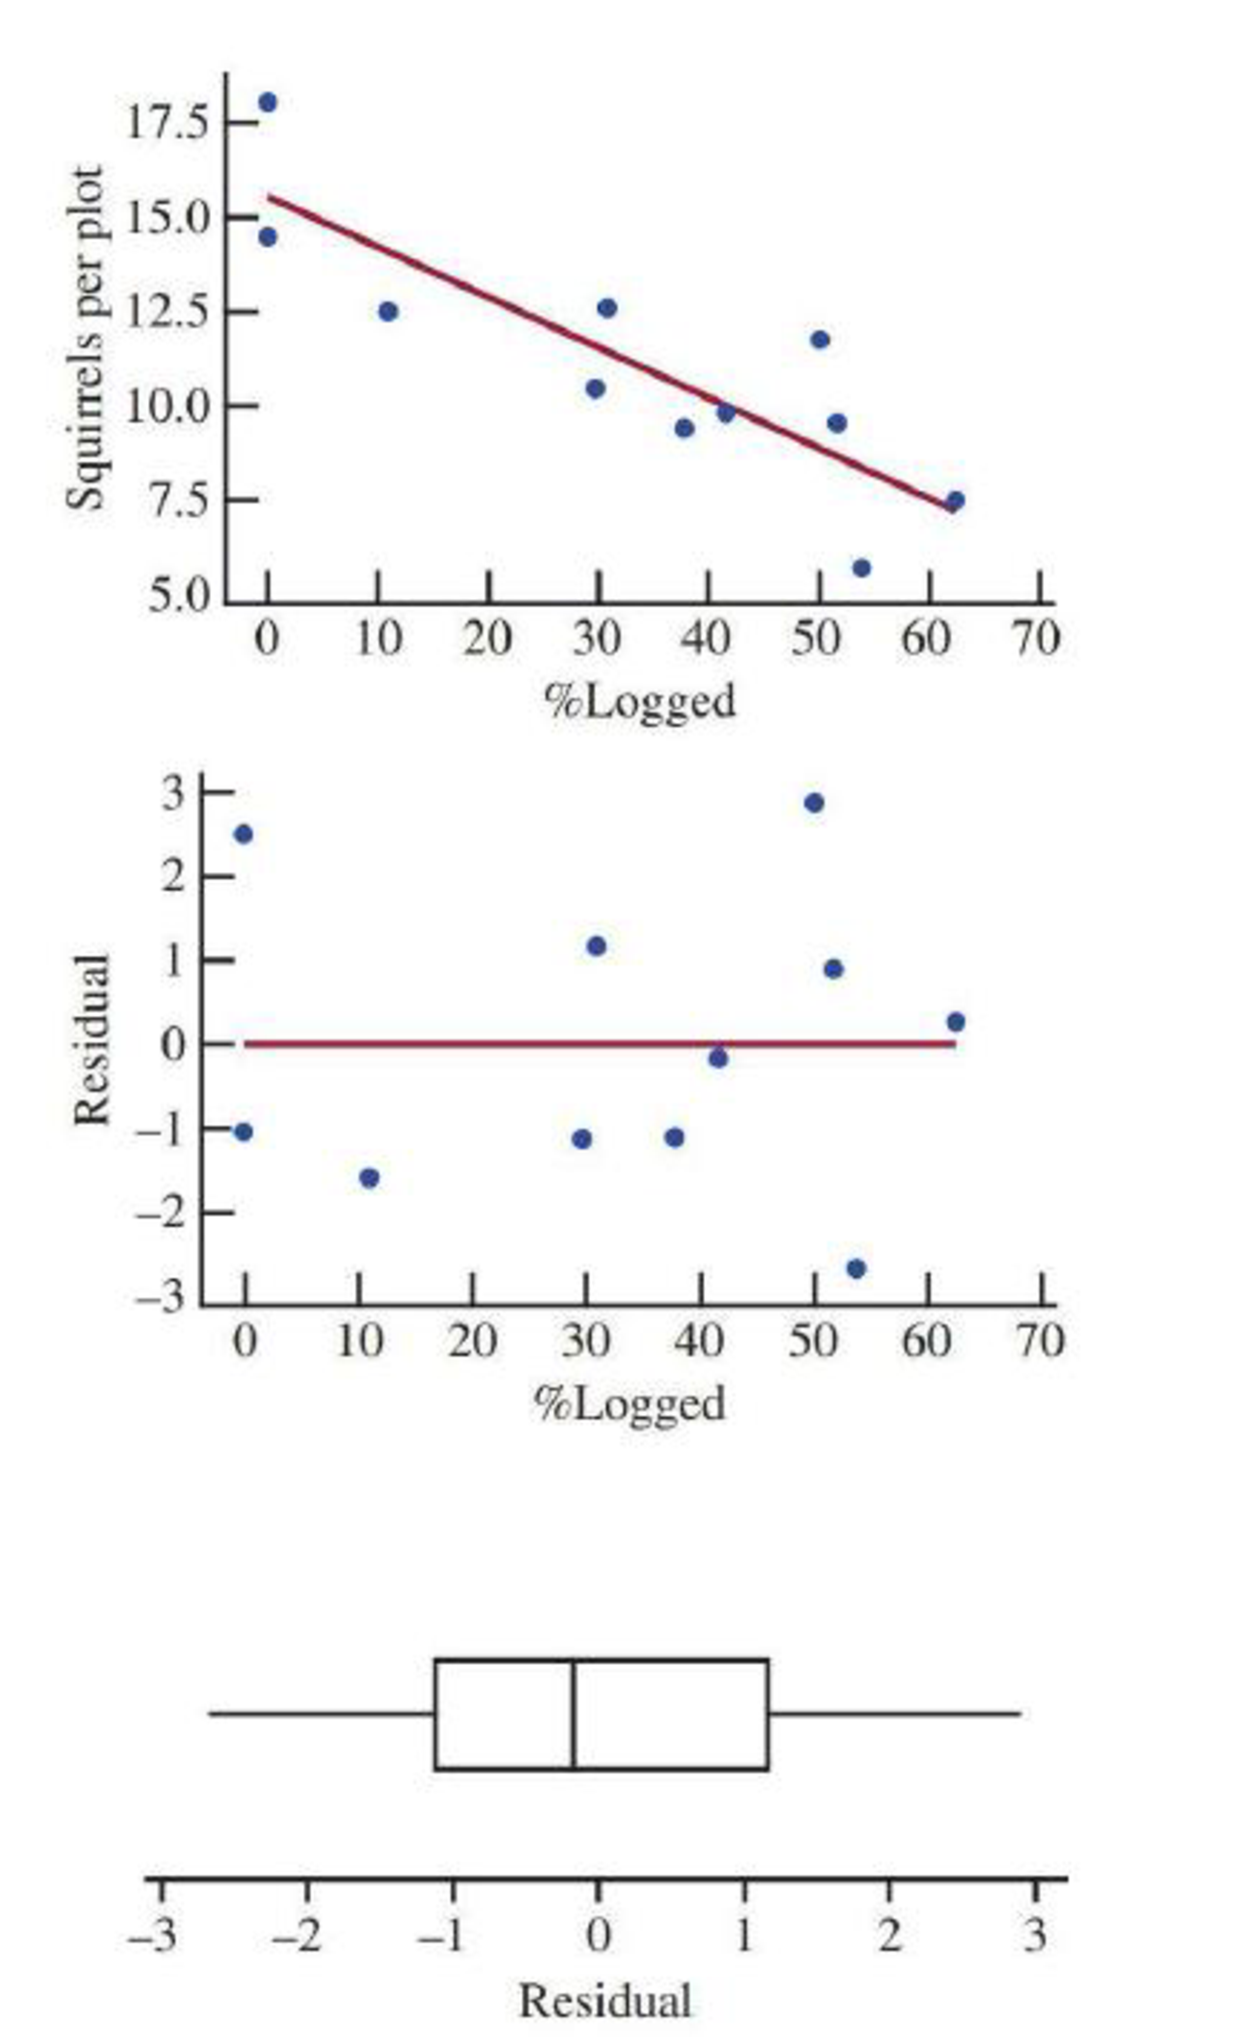
The graphs accompanying this exercise are based on data from an experiment to assess the effects of logging on a squirrel population in British Columbia (“Effects of Logging Pattern and Intensity on Squirrel Demography,” The Journal of Wildlife Management [2007]: 2655–2663). Plots of land, each 9 hectares in area, were subjected to different percentages of logging, and the squirrel population density for each plot was measured after 3 years. The
Does it appear that the assumptions of the simple linear regression model are plausible? Explain.

Trending nowThis is a popular solution!

Chapter 13 Solutions
Bundle: Introduction to Statistics and Data Analysis, 5th + WebAssign Printed Access Card: Peck/Olsen/Devore. 5th Edition, Single-Term


 Calculus For The Life SciencesCalculusISBN:9780321964038Author:GREENWELL, Raymond N., RITCHEY, Nathan P., Lial, Margaret L.Publisher:Pearson Addison Wesley,
 Glencoe Algebra 1, Student Edition, 9780079039897...AlgebraISBN:9780079039897Author:CarterPublisher:McGraw Hill
 Big Ideas Math A Bridge To Success Algebra 1: Stu...AlgebraISBN:9781680331141Author:HOUGHTON MIFFLIN HARCOURTPublisher:Houghton Mifflin Harcourt