
Applied Statistics in Business and Economics
5th Edition
ISBN: 9780077837303
Author: David Doane, Lori Seward Senior Instructor of Operations Management
Publisher: McGraw-Hill Education
expand_more
expand_more
format_list_bulleted
Concept explainers
Videos
Textbook Question
Chapter 13.3, Problem 9SE
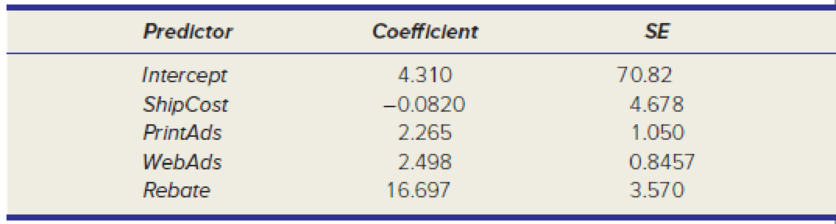
Observations are taken on net revenue from sales of a certain LCD TV at 50 retail outlets. The regression model was Y = net revenue (thousands of dollars), X1 = shipping cost (dollars per unit), X2 = expenditures on print advertising (thousands of dollars), X3 = expenditure on electronic media ads (thousands), X4 = rebate rate (percent of retail price). (a) Calculate the t statistic for each coefficient to test for β = 0. (b) Look up the critical value of Student’s t in Appendix D for a two-tailed test at α = .01. Which coefficients differ significantly from zero? (c) Use Excel to find the p-value for each coefficient.
Expert Solution & Answer
Want to see the full answer?
Check out a sample textbook solution
Students have asked these similar questions
For the regression model Yi = b0 + eI, derive the least squares estimator.
The quality of the orange juice produced by a certain manufacturer is constantly monitored. Data collected on the sweetness index of an orange juice sample and amount of water-soluble pectin for 24 production runs at a juice manufacturing plant are shown in the accompanying table. Suppose a manufacturer wants to use simple linear regression to predict the sweetness (y) from the amount of pectin (x). Find and interpret the coefficient of determination,
r2,
and the coefficient of correlation, r.
Find and interpret the coefficient of determination,
r2.
Select the correct choice below and fill in the answer box within your choice.
(Round to three decimal places as needed.)
A.
The coefficient of determination,
r2,
is
enter your response here.
Sample variations in the amount of water-soluble pectin explain
100r2%
of the sample variation in the sweetness index using the least squares line.
B.
The coefficient of determination,
r2,
is
enter your…
A fitted linear regression model is (y=10+2x ). If x = 0 and the corresponding observed value of y = 9, the residual at this observation is:
Chapter 13 Solutions
Applied Statistics in Business and Economics
Ch. 13.1 - Observations are taken on net revenue from sales...Ch. 13.1 - Observations are taken on sales of a certain...Ch. 13.1 - Prob. 3SECh. 13.1 - A regression model to predict Y, the...Ch. 13.2 - Refer to the ANOVA table below. (a) State the...Ch. 13.2 - Refer to the ANOVA table below. (a) State the...Ch. 13.2 - Prob. 7SECh. 13.2 - Refer to the ANOVA table below. (a) State the...Ch. 13.3 - Observations are taken on net revenue from sales...Ch. 13.3 - Observations are taken on sales of a certain...
Ch. 13.3 - Prob. 11SECh. 13.3 - A regression model to predict Y, the state...Ch. 13.4 - A regression of accountants starting salaries in a...Ch. 13.4 - An agribusiness performed a regression of wheat...Ch. 13.5 - Prob. 15SECh. 13.5 - A regression model to predict the price of...Ch. 13.5 - Prob. 17SECh. 13.5 - Prob. 18SECh. 13.6 - Prob. 19SECh. 13.6 - Prob. 20SECh. 13.7 - Prob. 21SECh. 13.7 - Using the Metals data, construct a correlation...Ch. 13.8 - Prob. 23SECh. 13.8 - Which violations of regression assumptions, if...Ch. 13 - (a) List two limitations of simple regression. (b)...Ch. 13 - (a) What does represent in the regression model?...Ch. 13 - Prob. 3CRCh. 13 - Prob. 4CRCh. 13 - Prob. 5CRCh. 13 - Prob. 6CRCh. 13 - Prob. 7CRCh. 13 - Prob. 8CRCh. 13 - Prob. 9CRCh. 13 - (a) State the formula for the standard error of...Ch. 13 - (a) What is a categorical predictor? (b) Why is a...Ch. 13 - Prob. 12CRCh. 13 - Prob. 13CRCh. 13 - (a) What is multicollinearity? (b) What are its...Ch. 13 - Prob. 15CRCh. 13 - (a) State the formula for a variance inflation...Ch. 13 - Prob. 17CRCh. 13 - Prob. 18CRCh. 13 - Prob. 19CRCh. 13 - Prob. 20CRCh. 13 - (a) Name two ways to detect autocorrelated...Ch. 13 - (a) What is a lurking variable? How might it be...Ch. 13 - Instructions for Data Sets: Choose one of the data...Ch. 13 - Note: Exercises marked are based on optional...Ch. 13 - Prob. 27CECh. 13 - Note: Exercises marked are based on optional...Ch. 13 - Note: Exercises marked are based on optional...Ch. 13 - Prob. 30CECh. 13 - Prob. 31CECh. 13 - Prob. 32CECh. 13 - Prob. 33CECh. 13 - Prob. 34CECh. 13 - Prob. 35CECh. 13 - Note: Exercises marked are based on optional...Ch. 13 - Note: Exercises marked are based on optional...Ch. 13 - Note: Exercises marked are based on optional...Ch. 13 - Prob. 39CECh. 13 - Prob. 40CECh. 13 - Prob. 41CECh. 13 - In a model of Fords quarterly revenue TotalRevenue...Ch. 13 - In a study of paint peel problems, a regression...Ch. 13 - A hospital emergency room analyzed n = 17,664...Ch. 13 - Prob. 45CECh. 13 - A researcher used stepwise regression to create...Ch. 13 - A sports enthusiast created an equation to predict...Ch. 13 - An expert witness in a case of alleged racial...Ch. 13 - Prob. 50CECh. 13 - Prob. 51CECh. 13 - Prob. 52CECh. 13 - Which statement is correct concerning one-factor...Ch. 13 - Prob. 2ERQCh. 13 - Prob. 3ERQCh. 13 - Prob. 4ERQCh. 13 - Prob. 5ERQCh. 13 - Prob. 6ERQCh. 13 - Prob. 7ERQCh. 13 - Prob. 8ERQCh. 13 - Prob. 9ERQCh. 13 - Prob. 10ERQCh. 13 - Prob. 11ERQCh. 13 - Prob. 12ERQCh. 13 - Prob. 13ERQCh. 13 - Prob. 14ERQCh. 13 - Prob. 15ERQ
Knowledge Booster


Learn more about
Need a deep-dive on the concept behind this application? Look no further. Learn more about this topic, statistics and related others by exploring similar questions and additional content below.Similar questions
- A study was done to determine the relationship between the alcohol content of beer, and the amount of calories in a 12 oz serving size. The sample data is provided in the data below. a) From this sample data, can you conclude (at the alpha=0.05 level) that there is in fact a linear correlation between the two variables? Use the statistics (correlation coefficient, value) to describe the correlation (if any). B) Using the sample data, find a regression equation to estimate the number of calories in a beer. C) Dogfish Head Brewery in Milton, Delaware has an I.P.A. beer called "120 minute IPA" which has an alcohol content of 18%. Using your regression equation, estimate the number of calories in a 12 oz serving of 120 Minute. Brand/Beer Alcohol Content (%) Calories (per 12 oz) Big Sky Scape Goat Pale Ale 4.70 163 Sierra Nevada Harvest Ale 6.70 215 Steel Reserve 8.10 222 Coors Light 4.15 104 Genesee Cream Ale 5.10 162 Sierra Nevada Summeefest Beer 5.00 158 Michelob Beer…arrow_forwardThe table shows a part of an output of a linear regression model predicting the average fare on different flight routes. Data Table Regression Table Coefficient Constant 95.80976147 COUPON −9.61654124 DISTANCE 0.080733811 PAX −0.000167343 What is the difference in prediction of the following two routes? Route A that is 3,000 miles, with COUPON=1.5 and PAX=6,000 Route B that is 3,000 miles, with COUPON=1.2 and PAX=6,000.arrow_forwardAn article reported that for a regression of y = average SAT score on x = expenditure per pupil, based on data from n = 44 New Jersey school districts, a = 766, b = 0.015, r2 = 0.160, and se = 53.7. One observation in the sample was (9400, 897). What average SAT score would you predict for this district, and what is the corresponding residual?Predict average SAT score _______ Residual ________arrow_forward
- The mortality rate of a sample of the population as a function of daily tobacco consumption can be seen below: Number of cigarettes "x": 3 5 6 15 20 Mortality rate "y" : 0.2 0.3 0.4 0.5 0.7 With these data, solve the following: a. Determine and interpret the correlation coefficient. b. Find the regression line of y on x. c. What will be the mortality rate for a consumer of 40 cigarettes per day?arrow_forwardThe birth lengths in cm (x) and birth weights in kg (y) of a sample of 50 newborn female babies are compared, yielding a correlation coefficient of r=0.578 and a linear regression equation of ŷ =−8.89+0.243x The babies all had lengths between 46.5 and 53.0 cm, and weights between 2.50 and 4.05 kg. Based on this, predict the birth weight of a newborn female baby with a birth length of 48.5 cm.arrow_forwardIn a simple linear regression model, the correlation coefficient between x and y is 0.8. What can you say about the strength and direction of the relationship between x and y?arrow_forward
- I have some doubts regarding linear regression. if any 2 variables in X1, X2 AND Y have a positive correlation, then in the linear regression Y = b0 + b1X1 +b2X2 +e, will the sign of b1 and b2 both be positive? will the residuals that we get from linear regression will always be uncorrelated given X?arrow_forwardGiven a generic data set (x,y) with a linear regression. How do you determine if the y(dependent) will be less/greater than a certain value at a decided value of x?arrow_forwardAssume that there is a positive linear correlation between the variable R (return rate in percent of financial investment) and the variable t (age in years of the investment) given by the regression equation R = 2.5t + 5.3. 1- If the investment continues to grow at a constant rate, what is the expected return rate when the investment is 7 years old?arrow_forward
- The monthly premium quoted by an insurance company for a critical illness policy was collected from a sample of 6 adult male smokers at different age. The data for the sample are shown: Age 28 25 50 39 47 31 Premium ($) 75 40 175 125 250 105 Using Age to predict premium, the Linear Regression equation is given by: ŷ =6.556X−112 and r2=0.813y^=6.556X−112 and r2=0.813 a. Identify the independent and Dependent variables. Dependent: Age Premium Independent: Age Premium b. Determine the slope. Slope = Slope = Round to 3 decimal places c. Determine |r||r| . |r|=|r|= Round to 3 decimal places d. Interpret rr : and e. Determine critical r value at 5% significance level and determine if there is a significant linear correlation exists. |r| critical=|r| critical= Round to 3 decimal places Linear Correlation:Linear Correlation: Significant Not Significant f. Predict the monthly premium for a 40 years old adult male smoker.…arrow_forwardIn an attempt to develop a model of wine quality as judged by wine experts, data on alcohol content and wine quality was collected from variants of a particular wine. From a sample of 17 wines, a model was created using the percentages of alcohol to predict wine quality. From the results of that regression, b1=0.4386 and Sb1=0.1141. a. At the 0.05 level of significance, is there evidence of a linear relationship between the percentage of alcohol and wine quality? b. Construct a 95% confidence interval estimate of the population slope, β1. b. The 95% confidence interval is __ ≤ β1 ≤ __ (Round to three decimal places as needed.)arrow_forwardIn a fisheries researcher's experiment, the correlation between the number of eggs in the nest and the number of viable (surviving) eggs for a sample of nests is r = 0.67. The equation of the regression line for number of viable eggs y versus number of eggs in the nest x is y = 0.72x + 17.07. For a nest with 140 eggs, what is the predicted number of viable eggs?arrow_forward
arrow_back_ios
SEE MORE QUESTIONS
arrow_forward_ios
Recommended textbooks for you
 MATLAB: An Introduction with ApplicationsStatisticsISBN:9781119256830Author:Amos GilatPublisher:John Wiley & Sons Inc
 Probability and Statistics for Engineering and th...StatisticsISBN:9781305251809Author:Jay L. DevorePublisher:Cengage Learning
 Statistics for The Behavioral Sciences (MindTap C...StatisticsISBN:9781305504912Author:Frederick J Gravetter, Larry B. WallnauPublisher:Cengage Learning
 Elementary Statistics: Picturing the World (7th E...StatisticsISBN:9780134683416Author:Ron Larson, Betsy FarberPublisher:PEARSON
 The Basic Practice of StatisticsStatisticsISBN:9781319042578Author:David S. Moore, William I. Notz, Michael A. FlignerPublisher:W. H. Freeman
 Introduction to the Practice of StatisticsStatisticsISBN:9781319013387Author:David S. Moore, George P. McCabe, Bruce A. CraigPublisher:W. H. Freeman
MATLAB: An Introduction with Applications
Statistics
ISBN:9781119256830
Author:Amos Gilat
Publisher:John Wiley & Sons Inc
Probability and Statistics for Engineering and th...
Statistics
ISBN:9781305251809
Author:Jay L. Devore
Publisher:Cengage Learning
Statistics for The Behavioral Sciences (MindTap C...
Statistics
ISBN:9781305504912
Author:Frederick J Gravetter, Larry B. Wallnau
Publisher:Cengage Learning
Elementary Statistics: Picturing the World (7th E...
Statistics
ISBN:9780134683416
Author:Ron Larson, Betsy Farber
Publisher:PEARSON
The Basic Practice of Statistics
Statistics
ISBN:9781319042578
Author:David S. Moore, William I. Notz, Michael A. Fligner
Publisher:W. H. Freeman
Introduction to the Practice of Statistics
Statistics
ISBN:9781319013387
Author:David S. Moore, George P. McCabe, Bruce A. Craig
Publisher:W. H. Freeman
Correlation Vs Regression: Difference Between them with definition & Comparison Chart; Author: Key Differences;https://www.youtube.com/watch?v=Ou2QGSJVd0U;License: Standard YouTube License, CC-BY
Correlation and Regression: Concepts with Illustrative examples; Author: LEARN & APPLY : Lean and Six Sigma;https://www.youtube.com/watch?v=xTpHD5WLuoA;License: Standard YouTube License, CC-BY