
Concept explainers
Videos
i.
To identify:
The independent variable
i.
Answer to Problem 13.4E
Independent variable
Explanation of Solution
Given information:
Formula used:
The student’s t- statistics is given by the following expression:
The values:
Calculation:
To identify which independent variable
The
To test the null hypothesis:
Vs
And,
1. At
The student’s t- statistics is calculated as:
The corresponding
Reject the null hypothesis
Hence, independent variable
2. At
The student’s t- statistics is calculated as:
The corresponding
Reject the null hypothesis
Hence, independent variable
3. At
The student’s t- statistics is calculated as:
The corresponding
Reject the null hypothesis
Hence, independent variable
Conclusion:
Therefore, all independent variable
ii.
The least-square prediction equation
ii.
Answer to Problem 13.4E
The least-square prediction equation is
Explanation of Solution
Given information:
Calculation:
The line which makes the vertical distance from the data points to the regression line is known as least-square regression. This distance is as small as possible.
The least-square prediction equation is given by the following eq:
Put the given values:
Conclusion:
Hence, least-square prediction equation is derived as
iii.
To explain:
The relationship between lines shown by the graph the relationship between
iii.
Answer to Problem 13.4E
Lines shown by the graph is appearing to be parallel with each other
Explanation of Solution
Given information:
Predictor variables:
Calculation:
The given equation is
When
When
The below graph depicting the relationship between
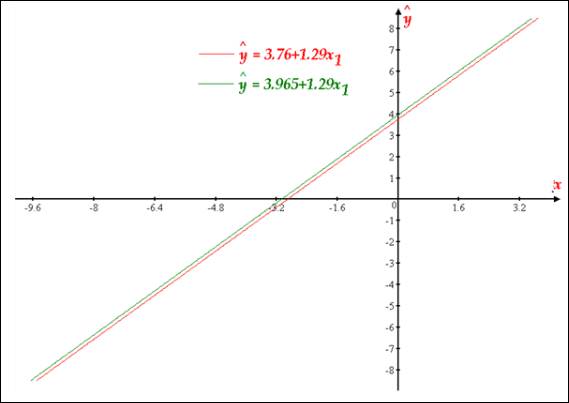
Two lines shown by graph are seems to be parallel with each other.
Conclusion:
The above graph depicting the relationship between the two lines and they appear to be parallel to each other.
iv.
To explain:
The practical interpretation of
iv.
Answer to Problem 13.4E
The measurement of changes in
Explanation of Solution
Three-dimensional extension line of means is depicted by the given eq.
When
Partial slopes of the model is denoted by
The measurement of changes occurs in
The slope estimated by a fit line with
Conclusion:
Hence, the unknown constant values are estimated by using the sample data.
Want to see more full solutions like this?
Chapter 13 Solutions
Introduction to Probability and Statistics


- The following fictitious table shows kryptonite price, in dollar per gram, t years after 2006. t= Years since 2006 0 1 2 3 4 5 6 7 8 9 10 K= Price 56 51 50 55 58 52 45 43 44 48 51 Make a quartic model of these data. Round the regression parameters to two decimal places.arrow_forwardOlympic Pole Vault The graph in Figure 7 indicates that in recent years the winning Olympic men’s pole vault height has fallen below the value predicted by the regression line in Example 2. This might have occurred because when the pole vault was a new event there was much room for improvement in vaulters’ performances, whereas now even the best training can produce only incremental advances. Let’s see whether concentrating on more recent results gives a better predictor of future records. (a) Use the data in Table 2 (page 176) to complete the table of winning pole vault heights shown in the margin. (Note that we are using x=0 to correspond to the year 1972, where this restricted data set begins.) (b) Find the regression line for the data in part ‚(a). (c) Plot the data and the regression line on the same axes. Does the regression line seem to provide a good model for the data? (d) What does the regression line predict as the winning pole vault height for the 2012 Olympics? Compare this predicted value to the actual 2012 winning height of 5.97 m, as described on page 177. Has this new regression line provided a better prediction than the line in Example 2?arrow_forwardThe grades of a class of 9 students on a midterm report (x) and on the final examination (y) are as follows: Give the following: a. linear regression line and equation b. computation of the coefficient of determination ?^2 c. Computation of the coefficient of correlation ? d. Estimate the final examination grade of a student who received a grade of 85 on the midterm report.arrow_forward
- Given below are results from the regression analysis where the dependent variable is the number of weeks a worker is unemployed due to a layoff (Unemploy) and the independent variables are the age of the worker (Age), the number of years of education received (Edu), the number of years at the previous job (Job Yr), a dummy variable for marital status (Married: 1=married, 0=otherwise), a dummy variable for head of household (Head: 1=yes, 0=no) and a dummy variable for management position (Manager: 1=yes, 0=no). We shall call this Model 1. The coefficient of partial determination (R2Yj.(All variables except j)) of each of the six predictors are, respectively, 0.2807, 0.0386, 0.0317, 0.0141, 0.0958, and 0.1201. Model 2 is the regression analysis where the dependent variable is Unemploy and the independent variables are Age and Manager. The results of the regression analysis are given. Refer to model 1. Which of the following is the correct null hypothesis to test…arrow_forwardThe personnel director of a large hospital is interested in determining the relationship (if any) between an employee’s age and the number of sick days the employee takes per year. The director randomly selects ten employees and records their age and the number of sick days which they took in the previous year. Employee 1 2 3 4 5 6 7 8 9 10Age 30 50 40 55 30 28 60 25 30 45Sick Days 7 4 3 2 9 10 0 8 5 2 The estimated regression equation and the standard error are given. Sick Days=14.310162−0.236900(Age) Se=1.682207 Find the 95% prediction interval for the average number of sick days an employee will take per year, given the employee is 34 . Round your answer to two decimal places.arrow_forwardA study of the amount of rainfall and the quantity of air pollution removed produced the following data shown in table below: Daily Rainfall x (0.01 cm) Particulate Removed y (μg/m3) 7 126 7.9 129.3 7.5 125.3 9.2 120.2 10.8 116.7 5.8 119.2 5.6 138.7 2.7 147.5 9.2 110.3 Compute and interpret the coefficient of determination, and coefficient of correlation for the given data. What will be the regression equation, when swapped depended and independent variablearrow_forward
 Linear Algebra: A Modern IntroductionAlgebraISBN:9781285463247Author:David PoolePublisher:Cengage Learning
 Glencoe Algebra 1, Student Edition, 9780079039897...AlgebraISBN:9780079039897Author:CarterPublisher:McGraw Hill
 Functions and Change: A Modeling Approach to Coll...AlgebraISBN:9781337111348Author:Bruce Crauder, Benny Evans, Alan NoellPublisher:Cengage Learning
 College AlgebraAlgebraISBN:9781305115545Author:James Stewart, Lothar Redlin, Saleem WatsonPublisher:Cengage Learning