
Videos
Wilcoxon Rank-Sum Test. In Exercises 5–8, use the Wilcoxon rank-sum test.
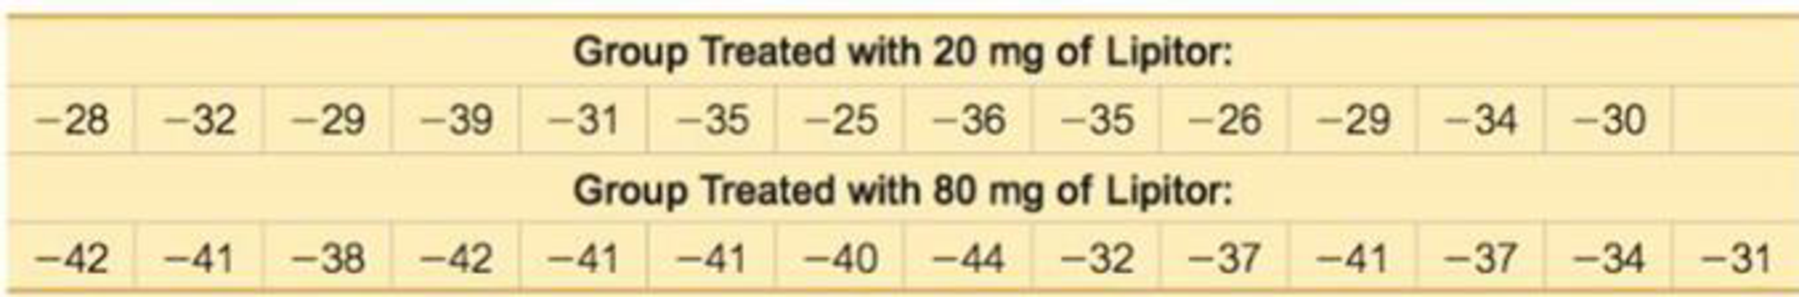
7. Clinical Trials of Lipitor The sample data below are changes in LDL cholesterol levels in clinical trials of Lipitor (atorvastatin). It was claimed that Lipitor had an effect on LDL cholesterol. (The data are based on results given in a Parke-Davis memo from David G. Orloff, M.D., the medical team leader for clinical trials of Lipitor. Pfizer declined to provide the author with the original data values.) Negative values represent decreases in LDL cholesterol. Use a 0.05 significance level to test the claim that for those treated with 20 mg of Lipitor and those treated with 80 mg of Lipitor, changes in LDL cholesterol have the same
Want to see the full answer?
Check out a sample textbook solution
Chapter 13 Solutions
ELEMENTARY STATISTICS


- 9arrow_forwardData in the following example are selected from a larger experiment on the use of drugs in the treatment of leprosy (Snedecor and Cochran 1967). Variables in the study are as follows: Drug two antibiotics (A and D) and a control (F) Pre-Treatment (X) a pretreatment score of leprosy bacilli Post-Treatment (Y) a posttreatment score of leprosy bacilli Ten patients are selected for each drug treatment, and six sites on each patient are measured for leprosy bacilli. The covariate (a pretreatment score) is included in the model for increased precision in determining the effect of drug treatments on the posttreatment count of bacilli. An Control Earrow_forwardTrace metals in drinking water affect the flavor and an unusually high concentration can pose a health hazard. Ten pairs of data were taken measuring zinc concentration in bottom water and surface water of a water source. Zinc Zinc concentration concentration in bottom Location in surface water water 1 .430 .415 .266 .238 3 .567 .390 4 .531 .410 .707 .605 .716 .609 7 .651 .632 8 .589 .523 .469 .411 10 .723 .612 Do the data support that the zinc concentration is less on the surface than the bottom of the water source, at the a = 0.1 level of significance? Note: A normal probability plot of difference in zinc concentration between the bottom and surface of water indicates the population could be normal and a boxplot indicated no outliers. a. Express the null and alternative hypotheses in symbolic form for this claim. Assume Ha = H1 – 12, where li is the population mean zinc concentration in the bottom of water and 42 is the mean zinc concentration in the surface of water. Ho: Ha Select…arrow_forward
- Statistics students in Oxnard College sampled 11 textbooks in the Condor bookstore and recorded the number of pages in each textbook and its cost. The bivariate data are shown below: Number of Pages (z) Cost(y) 432 60.16 972 136.36 423 67.99 715 108.95 762 112.06 478 71.14 307 53.91 472 70.36 839 106.07 306 46.78 634 93.42 A student calculates a linear model | z . (Please show your answers to 2 decimal places) y= Use the model to estimate the cost when number of pages is 584. Cost = $ (Please show your answer to 2 decimal places.)arrow_forwardplease show diagram of p valuearrow_forwardUsing the data below: How do we create a bivariate analysis?arrow_forward
- JASP Assignment -Statistics Class Survey 1. Independent samples t-test- In the pop-up window, select the 24 scale variables (Study thru Attend2) from the left-hand box and move them to the Dependent Variables box on the right 2. Examine the Output window to the right find significant differences between males and females on scale variables. Any p value that is less than .05 is significant. 3. Write a report of this exercise- describing the significant results and what they mean. For example, you would write something like this to describe the significant differences you find: We conducted an Independent Sample T-test on the 24 scale variables to compare males and females in this course. We found significant differences for the variable called ____, t(40) = 3.195, p < .05. This means males (M = 2.52) were significantly less likely to be 4. Make sure to list every SIGNIFICANT finding this way for both sex and athlete. Semester Sex Age Are you a student Athlete Study…arrow_forward10arrow_forwardTrace metals in drinking water affect the flavor and an unusually high concentration can pose a health hazard. Ten pairs of data were taken measuring zinc concentration in bottom water and surface water of a water source. Zinc Location concentration in concentration in bottom water Zinc surface water 1 .430 .415 2 .266 .238 3 .567 .390 .531 .410 .707 .605 .716 .609 7 .651 .632 8 .589 .523 9 .469 .411 10 .723 .612 Do the data support that the zinc concentration is less on the surface than the bottom of the water source, at the a =.1 level of significance? a) Express the null and alternative hypotheses in symbolic form for this claim. Assume d = bottom - surface. Enter != for + . Ho: Pd Ha: Pd b) What is the significance level? c) What is the test statistic? Round to 3 decimal places. d) What is the p-value? Round to 4 decimal places. p =arrow_forward
- ?How do you find D? Asking about the end behavior of the data?arrow_forwardPlease provide the answer using minitabarrow_forwardPlease show your work. Thank you.An experiment was conducted to investigate the effects of the concentrations of sulfuric acid (H2SO4) and calcium chloride (CaCl2) on the amount of black mud precipitate in the treatment of alkaline wastewater. There were three levels of each concentration, and two replicates of the experiment were made at each combination of levels. The relevant statistical analysis is provided in the following table: (image) a) Does there appear to be an interaction between concentration of sulfuric acid and calcium chloride at the .05 level? What does this say about the additive model? b) Can the effect of concentration of sulfuric acid on amount of black mud precipitate in the treatment of alkaline wastewater be described by interpreting the main effects of concentration of sulfuric acid? If so, interpret the main effects at the .05 level, including the appropriate test statistic and p-value. If not, explain why not.c) Can the effect of concentration of calcium…arrow_forward
 Linear Algebra: A Modern IntroductionAlgebraISBN:9781285463247Author:David PoolePublisher:Cengage Learning
 Glencoe Algebra 1, Student Edition, 9780079039897...AlgebraISBN:9780079039897Author:CarterPublisher:McGraw Hill