
Videos
Wilcoxon Rank-Sum Test. In Exercises 5–8, use the Wilcoxon rank-sum test.
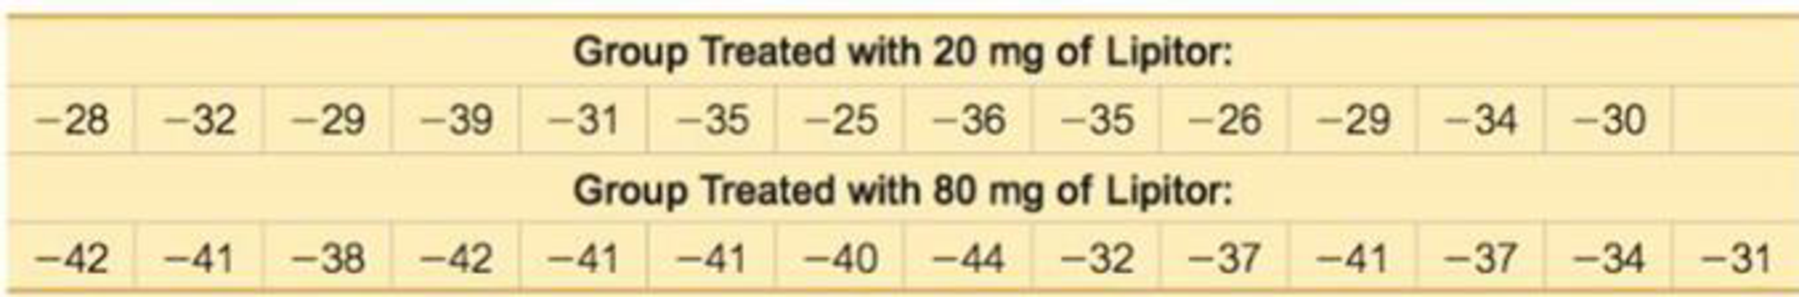
7. Clinical Trials of Lipitor The sample data below are changes in LDL cholesterol levels in clinical trials of Lipitor (atorvastatin). It was claimed that Lipitor had an effect on LDL cholesterol. (The data are based on results given in a Parke-Davis memo from David G. Orloff, M.D., the medical team leader for clinical trials of Lipitor. Pfizer declined to provide the author with the original data values.) Negative values represent decreases in LDL cholesterol. Use a 0.05 significance level to test the claim that for those treated with 20 mg of Lipitor and those treated with 80 mg of Lipitor, changes in LDL cholesterol have the same median. What do the results suggest?
Want to see the full answer?
Check out a sample textbook solution
Chapter 13 Solutions
ELEMENTARY STATISTICS WITH MYSTATLAB


- A local ice cream shop collects data on the temperature of the day and how many ice cream cones were sold that day. What type of data was collected? Bivariate and Quantitative Bivariate and Categorical Univariate and Quantitative Univariate and Categoricalarrow_forwardExercise 13-60 (Algo) (LO13-5) Waterbury Insurance Company wants to study the relationship between the amount of fire damage and the distance between the burning house and the nearest fire station. This information will be used in setting rates for insurance coverage. For a sample of 30 claims for the last year, the director of the actuarial department determined the distance from the fire station (x) and the amount of fire damage, in thousands of dollars (y). The MegaStat output is reported here: ANOVA table Source SS df MS F Regression 1,835.5782 1 1,835.5782 40.4537 Residual 1,270.4934 28 45.3748 Total 3,106.0716 29 Regression output Variables Coefficients Std. Error t(df=28) Intercept 14 3.1125 2.34 Distance–X 6 0.8778 6.36 Click here for the Excel Data File a-1. Determine the regression equation. (Round your answers to 3 decimal places.) a-2. Is there a direct or indirect relationship between the distance from…arrow_forwardGround Water. The U.S. Geological Survey, in cooperation with the Florida Department of Environmental Protection, investigated the effects of waste disposal practices on ground water quality at five poultry farms in north-central Florida. At one site, they drilled four monitoring wells, numbered 1, 2, 3, and 4. Over a period of 9 months, water samples were collected from the last three wells and analyzed for a variety of chemicals, including potassium, chlorides, nitrates, and phosphorus. The concentrations, in milligrams per liter, are provided on the WeissStats site. For each of the four chemicals, decide whether the data provide sufficient evidence to conclude that a difference exists in mean concentration among the three wells. Use α = 0.01. [SOURCE: USGS Water Resources Investigations Report 95-4064, Effects of Waste-Disposal Practices on Ground- Water Quality at Five Poultry (Broiler) Farms in North-Central Florida, H. Hatzell, U.S. Geological Survey] a. conduct a one-way ANOVA…arrow_forward
- review(37a): A psycharist hypothesized that patients with schizopherina , who stayed in the hospital the longest would score the lowest on a mental oreintation test. She collected data for six patients with shizophernia which are listed below. Years of Hospitalization Mental oreienation 6 5 7 3 12 2 5 7 3 8 8 4 test the hypothesis at 5% level of signifcance usinf the 5 step procedure..Round your answer to 2 decimal placesarrow_forwardExamine the relationship between amount of time spent studying for an exam (X) in hours and the score that person makes on an exam (Y) X Y 2 65 3 70 3 75 4 70 5 85 6 85 7 90 using spss Give the following: Null hypothesis Alternative hypothesis Statistical test Computation Decision Conclusionarrow_forwardAppendix B Data Sets. In Exercises 9–12, refer to the indicated data set in Appendix B and use the Wilcoxon rank-sum test. IQ and Lead Exposure Data Set 7 “IQ and Lead” in Appendix B lists performance IQ scores for a random sample of subjects with low lead levels in their blood and another random sample of subjects with high lead levels in their blood. Use a 0.05 significance level to test the claim that subjects with low lead levels have a higher median of the performance IQ score than those with high lead levels. Does lead exposure appear to have an adverse effect?arrow_forward
- Data set 20 in Appendix B of the textbook lists data from 100 M&M’s, and 8% of them are yellow. Use a 0.10 significance level to test the claim of the Mars candy company that the percentage of yellow M&M’s is no more than 13%.arrow_forwardEmpty Stomachs. In the publication “How Often Do Fishes ‘Run on Empty’?” (Ecology, Vol. 83, No 8, pp. 2145–2151), D. Arrington et al. examined almost 37,000 fish of 254 species from the waters of Africa, South and Central America, and North America to determine the percentage of fish with empty stomachs. The fish were classified as piscivores (fish-eating), invertivores (invertibrateeating), omnivores (anything-eating) and algivores/detritivores (eating algae and other organic matter). For those fish in African waters, the data on theWeissStats site give the proportions of each species of fish with empty stomachs. At the 1% significance level, do the data provide sufficient evidence to conclude that a difference exists in the mean percentages of fish with empty stomachs among the four different types of feeders? a. conduct a one-way ANOVA test on the data. b. interpret your results from part (a). c. decide whether presuming that the assumptions of normal populations and equal…arrow_forwardSelf-Reported Weight. The article “Accuracy of Self- Reported Height and Weight in a Community-Based Sample of Older African Americans and Whites” (Journal of Gerontology Series A: Biological Sciences and Medical Sciences, Vol. 65A, No. 10, pp. 1123–1129) by G. Fillenbaum et al. explores the relationship between measured and self-reported height and weight. The authors sampled African American and White women and men older than 70 years of age. A hypothesis test is to be performed to decide whether, on average, self-reported weight is less than measured weight for the aforementioned age group. a. identify the variable. b. identify the two populations. c. identify the pairs. d. identify the paired-difference variable. e. determine the null and alternative hypotheses. f. classify the hypothesis test as two tailed, left tailed, or right tailed.arrow_forward
- 1.“Effects of Short-Term Supplementation with Selenised Yeast on Milk Production and Composition of Lactating Cows”(Australian Journal of Dairy Technology, [2004]: 199-203) supplied the following data on milk selenium concentration (mg/L) for a sample of cows given seleniumsupplement (the treatment group) and a sample of cows given no supplement (the control group). The measurements of selenium were taken initally and again after a 9-day period. The study was conducted becausea deficiency of the trace element selenium in the diet can negatively impact growth, immunity, muscle and neuromuscular function, and fertility. The production of selenium supplements to dairy cows is justified when pastures have low selenium levels. data is attached a.Use the given data for the treatment group to determine if there is sufficient evidenceto conclude that the mean selenium concentration is greater after 9 days of the selenium supplement. b.Are the data for the cows in…arrow_forwardHerbal cancer A report in the New England Journal of Medicine notes growing evidence that the herb Aris-tolochia fangchi can cause urinary tract cancer in those who take it. Suppose you are asked to design an experi-ment to study this claim. Imagine that you have data on urinary tract cancers in subjects who have used thisherb and similar subjects who have not used it and thatyou can measure incidences of cancer and precancerouslesions in these subjects. State the null and alternativehypotheses you would use in your study.arrow_forwardLobbying Congress. In the special report, “Bitter Pill: Why Medical Bills Are Killing Us” (TIME, Vol. 181, No. 8, 2013), S. Brill presented an in-depth investigation of hospital billing practices that reveals why U.S. health care spending is out of control. One of the many statistics provided in the report is that, during the period from 1998 through 2012, the pharmaceutical and health-care-products industries and organizations representing doctors, hospitals, nursing homes, health services, and HMOs spent $5.36 billion lobbying Congress. a. Under what conditions would the $5.36 billion lobbyingexpenditure figure be a descriptive statistic? Explain your answer. b. Under what conditions would the $5.36 billion lobbyingexpenditure figure be an inferential statistic? Explain your answer.arrow_forward
 MATLAB: An Introduction with ApplicationsStatisticsISBN:9781119256830Author:Amos GilatPublisher:John Wiley & Sons Inc
 Probability and Statistics for Engineering and th...StatisticsISBN:9781305251809Author:Jay L. DevorePublisher:Cengage Learning
 Statistics for The Behavioral Sciences (MindTap C...StatisticsISBN:9781305504912Author:Frederick J Gravetter, Larry B. WallnauPublisher:Cengage Learning
 Elementary Statistics: Picturing the World (7th E...StatisticsISBN:9780134683416Author:Ron Larson, Betsy FarberPublisher:PEARSON
 The Basic Practice of StatisticsStatisticsISBN:9781319042578Author:David S. Moore, William I. Notz, Michael A. FlignerPublisher:W. H. Freeman
 Introduction to the Practice of StatisticsStatisticsISBN:9781319013387Author:David S. Moore, George P. McCabe, Bruce A. CraigPublisher:W. H. Freeman