
Concept explainers
Videos
Tax Research. A study reported in The Accounting Review examined the separate and joint effects of two levels of time pressure (low and moderate) and three levels of knowledge (naive, declarative, and procedural) on key word selection behavior in tax research. Subjects were given a tax case containing a set of facts, a tax issue, and a key word index consisting of 1336 key words. They were asked to select the key words they believed would refer them to a tax authority relevant to resolving the tax case. Prior to the experiment, a group of tax experts determined that the text contained 19 relevant key words. Subjects in the naive group had little or no declarative or procedural knowledge, subjects in the declarative group had significant declarative knowledge but little or no procedural knowledge, and subjects in the procedural group had significant declarative knowledge and procedural knowledge. Declarative knowledge consists of knowledge of both the applicable tax rules and the technical terms used to describe such rules. Procedural knowledge is knowledge of the rules that guide the tax researcher’s search for relevant key words. Subjects in the low time pressure situation were told they had 25 minutes to complete the problem, an amount of time which should be “more than adequate” to complete the case: subjects in the moderate time pressure situation were told they would have “only” 11 minutes to complete the case. Suppose 25 subjects were selected for each of the six treatment combinations and the sample means for each treatment combination are as follows (standard deviations are in parentheses).
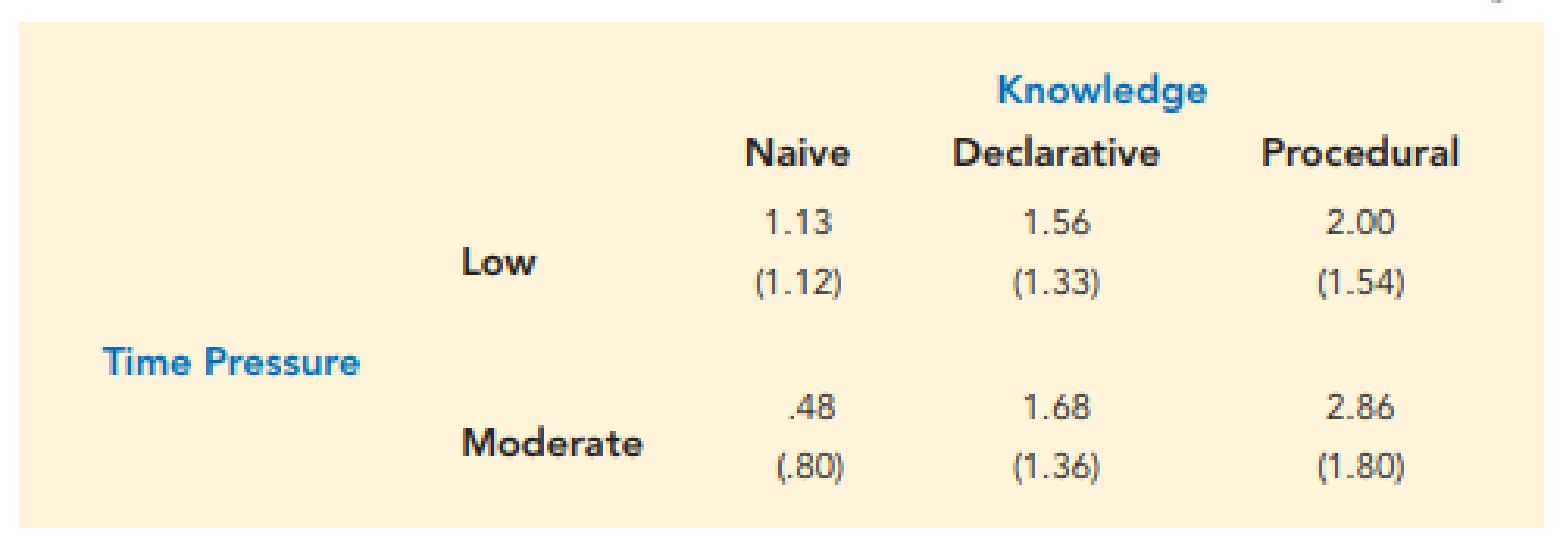
Use the ANOVA procedure to test for any significant differences due to time pressure, knowledge, and interaction. Use a .05 level of significance. Assume that the total sum of squares for this experiment is 327.50.

Trending nowThis is a popular solution!

Chapter 13 Solutions
MindTap Business Statistics, 1 term (6 months) Printed Access Card for Anderson/Sweeney/Williams/Camm/Cochran's Essentials of Statistics for Business and Economics, 8th


- The Consumer Reports Restaurant Customer Satisfaction Survey is based upon 148,599 visits to full-service restaurant chains (Consumer Reports website). One of the variables in the study is meal price, the average amount paid per person for dinner and drinks, minus the tip. Suppose a reporter for the Sun Coast Times thought that it would be of interest to her readers to conduct a similar study for restaurants located on the Grand Strand section in Myrtle Beach, South Carolina. The reporter selected a sample of 8 seafood restaurants, 8 Italian restaurants, and 8 steakhouses. The following data show the meal prices ($) obtained for the 24 restaurants sampled. Use a = 0.05 to test whether there is a significant difference among the mean meal price for the three types of restaurants. Please answer the questions in the image.arrow_forwardThe paper “State-Level Cancer Mortality Attributable to Cigarette Smoking in the United States’, (JAMA Internal Medicine [2016]: 1792-1798) included the following state estimates of the total number cancer deaths attributable to cigarette smoking in 2014. Number of State Number of People Number of State Number of People Alabama 3,183 Montana 581 Alaska 296 Nebraska 927 Arizona 3,246 Nevada 1,535 Arkansas 2,175 New Hampshire 723 California 14,689 New Jersey 4,388 Colorado 1,876 New Mexico 964 Connecticut 1,774 New York 9,296 Delaware 591 North Carolina 5,844 District of Columbia 310 North Dakota 341 Florida 12,596 Ohio 7,598 Georgia 4,816 Oklahoma 2,441 Hawaii 642 Oregon 2,143 Idaho 731 Pennsylvania 7,931 Illinois 7,114 Rhode Island 631 Indiana 4,099 South Carolina 2,962 Iowa 1,793 South Dakota 476 Kansas…arrow_forwardwhich of the following is/are an example of an expert system? Select one or more: a. Clinical support system b. Stock market prediction c. Face recognition d. Image captioningarrow_forward
- If we have a qualitative predictor variable with four possible categories, say, A, B, C, and D, and if x1, x2, and x3 are, respectively, the indicator variables for categories A, B, and C, give a table of the values of x1, x2, and x3 for the fourcategories A, B, C, and D.arrow_forwardFor a local basketball league, there were 10 teams whose players were assigned to a team based on their score on an abilities test. Those results are given below. Team 1 Team 2 Team 3 Team 4 Team 5 Team 6 Team 7 Team 8 Team 9 Team 10 87 98 103 105 90 108 94 108 97 109 81 91 80 87 78 91 82 89 90 87 70 85 78 77 77 77 76 76 86 76 64 82 77 74 72 67 75 72 73 69 63 76 64 62 70 60 66 66 69 68 62 56 63 57 64 58 62 63 66 67 56 48 55 56 57 54 55 51 58 57 55 44 48 53 52 53 49 49 50 56 52 42 42 47 39 47 46 46 48 56 40 44 The summary statistics are: SUMMARY Groups Count Sum Average Variance Team 1 9 590 65.55556 140.7778 Team 2 9 622 69.11111 470.3611 Team 3 9 610 67.77778 354.4444 Team 4 9…arrow_forwardA survey of 800 college seniors resulted in the following crosstabulation (Table 1) regarding their undergraduate major and whether or not they plan to go to graduate school. Please use the information to answer questions 3-6. Undergraduate Major Graduate School Business Engineering Others Total Yes 70 84 126 280 No 182 208 130 520 Total 252 292 256 800 Among the students who plan to go to graduate school, what percentage indicated "Other" majors?arrow_forward
- Classify the following studies as either descriptive or inferential and explain your answers. The accompanying chart shows the lobbying spending by five selected companies during 2014. Manycompanies spend millions of dollars to win favors in Washington. According to Fortune Magazine of June 1,2015, “Comcast has remained one of the biggest corporate lobbyists in the country.” In 2014, Comcast spent$17 million, Google spent $16.8 million, AT&T spent $14.2 million, Verizon spent $13.3 million, and TimeWarner Cable spent $7.8 million on lobbying.arrow_forwardA problem with a phone line that prevents a customer from receiving or making calls is upsetting to both the customer and the telecommunications company. The file Phone contains samples of 20 problems reported to two different offices of a telecommunications company and the time to clear these problems (in minutes) from the customers’ lines Central Office I Time to Clear Problems (minutes) 1.48 1.75 0.78 2.85 0.52 1.60 4.15 3.97 1.48 3.10 1.02 0.53 0.93 1.60 0.80 1.05 6.32 3.93 5.45 0.97 Central Office II Time to Clear Problems (minutes) 7.55 3.75 0.10 1.10 0.60 0.52 3.30 2.10 0.58 4.02 3.75 0.65 1.92 0.60 1.53 4.23 0.08 1.48 1.65 0.72 Perform a hypothesis test to determine if there’s evidence in this data of a difference in the mean waiting time between the two offices by answering the following questions: (a) What are the null and alternate hypotheses for this test? (b) Assuming that the population variances from both offices are equal, what is…arrow_forwardA problem with a phone line that prevents a customer from receiving or making calls is upsetting to both the customer and the telecommunications company. The file Phone contains samples of 20 problems reported to two different offices of a telecommunications company and the time to clear these problems (in minutes) from the customers’ lines: Central Office I Time to Clear Problems (minutes) 1.48 1.75 0.78 2.85 0.52 1.60 4.15 3.97 1.48 3.10 1.02 0.53 0.93 1.60 0.80 1.05 6.32 3.93 5.45 0.97 Central Office II Time to Clear Problems (minutes) 7.55 3.75 0.10 1.10 0.60 0.52 3.30 2.10 0.58 4.02 3.75 0.65 1.92 0.60 1.53 4.23 0.08 1.48 1.65 0.72 Perform a hypothesis test to determine if there’s evidence in this data of a difference in the mean waiting time between the two offices by answering the following questions: (b) Assuming that the population…arrow_forward
- A. Classify each of the following as primary or secondary data.1. newspapers and television reports2. census data and household survey data collected by the Philippine Statistics Association3. data obtained through laboratory experiment.4. data obtained by a researcher to determine the influence of online payments on consumerspending5. information obtained from various businesses reports B. Identify the data collection method used in the following statements:1. A researcher investigates the influence of online payments on consumer spending.2. A local TV network asked the voters to indicate whom they voted as they exited the pollingbooth.3. The school administration asked the students whether they are willing to have an increase inlaboratory fees if there is an upgrade of computers.4. A social welfare organization gathers information on hospital patients with mental disorders.5. An investigator uses information from various business reports for analysis. 1. If you had Php 1,000,000.00…arrow_forwardDo ethnic group and gender influence the type of care that a heart patient receives? The following pas- sage is from the article “Heart Care Reflects Race and Sex, Not Symptoms” (USA Today, February 25, 1999, reprinted with permission):Previous research suggested blacks and women were less likely than whites and men to get cardiac cathe- terization or coronary bypass surgery for chest pain or a heart attack. Scientists blamed differences in illness severity, insurance coverage, patient preference, and health care access. The researchers eliminated those differences by videotaping actors—two black men, two black women, two white men, and two white women—describing chest pain from identical scripts. They wore identical gowns, used identical gestures, and were taped from the same position. Researchers asked 720 primary care doctors at meetings of the American College of Physicians or the American Academy of Family Physicians to watch a tape and recommend care. The doctors thought the…arrow_forwardA problem with a phone line that prevents a customer from receiving or making calls is upsetting to both the customer and the telecommunications company. The file “Phone” contains samples of 20 problems reported to two different offices of a telecommunications company and the time toclear these problems (in minutes) from the customers’ lines: Central Office I Time to Clear Problems (minutes) 1.48 1.75 0.78 2.85 0.52 1.60 4.15 3.97 1.48 3.10 1.02 0.53 0.93 1.60 0.80 1.05 6.32 3.93 5.45 0.97 Central Office II Time to Clear Problems (minutes) 7.55 3.75 0.10 1.10 0.60 0.52 3.30 2.10 0.58 4.02 3.75 0.65 1.92 0.60 1.53 4.23 0.08 1.48 1.65 0.72 Assuming that the population variances from both offices are not equal, is there evidence of a difference in the mean waiting time between two offices? (Use a = 0.01) ▪ You may need to download file “Phone”. Referring to Table 10-2, which of the following is an appropriate null hypothesis? Question 2 options: 1)…arrow_forward
 MATLAB: An Introduction with ApplicationsStatisticsISBN:9781119256830Author:Amos GilatPublisher:John Wiley & Sons Inc
 Probability and Statistics for Engineering and th...StatisticsISBN:9781305251809Author:Jay L. DevorePublisher:Cengage Learning
 Statistics for The Behavioral Sciences (MindTap C...StatisticsISBN:9781305504912Author:Frederick J Gravetter, Larry B. WallnauPublisher:Cengage Learning
 Elementary Statistics: Picturing the World (7th E...StatisticsISBN:9780134683416Author:Ron Larson, Betsy FarberPublisher:PEARSON
 The Basic Practice of StatisticsStatisticsISBN:9781319042578Author:David S. Moore, William I. Notz, Michael A. FlignerPublisher:W. H. Freeman
 Introduction to the Practice of StatisticsStatisticsISBN:9781319013387Author:David S. Moore, George P. McCabe, Bruce A. CraigPublisher:W. H. Freeman