
Concept explainers
Videos
For Exercises 1 through 12, use the Kruskal-Wallis test and perform these steps.
a. State the hypotheses and identify the claim.
b. Find the critical value.
c. Compute the test value.
d. Make the decision.
e. Summarize the results.
Use the traditional method of hypothesis testing unless otherwise specified.
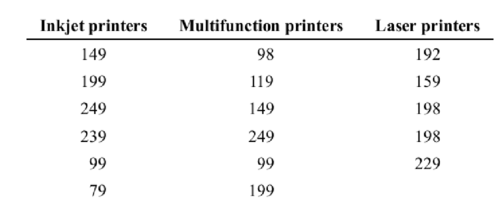
8. Printer Costs An electronics store manager wishes to compare the costs (in dollars) of three types of computer printers. The randomly selected data are shown. At α = 0.05, can it be concluded that there is a difference in the prices? Based on your answer, do you think that a certain type of printer generally costs more than the other types?
Want to see the full answer?
Check out a sample textbook solution
Chapter 13 Solutions
ELEMENTARY STATISTICS W/CONNECT >IP<
Additional Math Textbook Solutions
STATS:DATA+MODELS-W/DVD
EBK STATISTICAL TECHNIQUES IN BUSINESS
Elementary Statistics ( 3rd International Edition ) Isbn:9781260092561
Elementary Statistics (Text Only)
The Practice of Statistics for AP - 4th Edition
Research Methods for the Behavioral Sciences (MindTap Course List)


- Use the five steps in the hypothesis testing procedure for each answer. 1 ) A national publishing house claims that 45% of all weekly magazine readers in South Africa read their publication. Test this claim at the 5% significance level, if a survey found that 205 out of a random sample of 500 magazine readers said that they read the relevant publication.arrow_forwardWrite the following five steps of hypothesis test: 1. Set a set of hypotheses 2. Determine rejection rule with a given a (Fa). 3. Compute test statistic (F-Value) 4. Make judgment 5. Interpretation with p-value Utilize excel output to conduct your answers.arrow_forwardGiven the situation below, create a problem and determine (a) the null and alternative hypotheses, (b) test statistic, (c) rejection region, and (d) applicability of the CLT.arrow_forward
- You are working for the South Tahoe Tourist Bureau and are interested in determining if there is a relationship between the casino people frequent and the type of gambling that they do at the casino Table Games Slots Sports Harrah’s 50 60 12 Hard Rock 18 22 6 MontBleu 33 29 20 Harvey’s 41 39 20 a. State the null and alternative hypotheses. b. State which hypothesis test should be used. Calculate the p-Value and state the command you entered in the calculator. c. State the conclusion in the context of the problem.arrow_forwardPlease answer the three empty boxes and "Perform a paired t test. Let μ1 be the population mean adindex rating for cola A and let μ2 be the population mean adindex rating for cola B. What are the null and alternative hypotheses?"arrow_forwardFind the P value for the indicated hypothesis testarrow_forward
- In performing a hypothesis T-test, the p-value was 0.00046 and the significance level was 5%. What is the conclusion? Is it a,b,or c? a. Reject the null hypothesis and accept the alternate hypothesis b. Accept both the null hypothesis and alternate hypothesis c. Fail to reject the null hypothesisarrow_forwardYou are given the following hypotheses H 0 :p=0.3 H A :p not equal 0.3 We know that the sample size 90. For what sample proportion would the pvalue be equal to 0.1? Assume that all conditions necessary for Inference are satisfied.arrow_forwardThe p-value for a hypothesis test turns out to be 0.05015. At a 2% level of significance, what is the proper decision? Reject H0H0 Fail to reject H0arrow_forward
- Can you help me determine the P value for the following hypothesis test?arrow_forwardAssume that 40% of students at SCC receive A or B’s, 35% receive C’s, and 25% receive D or F’s. A survey of 300 r/s UC Davis students indicates that 100 of them received A or B’s, 130 received C’s, and 70 received D or F’s. Do these results provide strong evidence that the overall percentages of the 3 grade categories at UC Davis are not all the same as the ones at SCC? Perform a hypothesis test and use a p-value to draw and explain your conclusion.(a) Use an appropriate formula to calculate the expected counts.(b) Use an appropriate formula to calculate the test statistic.(c)Use an appropriate table to estimate the p-value. Do not draw any conclusionarrow_forwardBrown wants to conduct an assessment of where employees live and how employees work. Brown wanted to know if where you lived was related to how you worked. What hypothesis tests can be used in this case?arrow_forward
 MATLAB: An Introduction with ApplicationsStatisticsISBN:9781119256830Author:Amos GilatPublisher:John Wiley & Sons Inc
 Probability and Statistics for Engineering and th...StatisticsISBN:9781305251809Author:Jay L. DevorePublisher:Cengage Learning
 Statistics for The Behavioral Sciences (MindTap C...StatisticsISBN:9781305504912Author:Frederick J Gravetter, Larry B. WallnauPublisher:Cengage Learning
 Elementary Statistics: Picturing the World (7th E...StatisticsISBN:9780134683416Author:Ron Larson, Betsy FarberPublisher:PEARSON
 The Basic Practice of StatisticsStatisticsISBN:9781319042578Author:David S. Moore, William I. Notz, Michael A. FlignerPublisher:W. H. Freeman
 Introduction to the Practice of StatisticsStatisticsISBN:9781319013387Author:David S. Moore, George P. McCabe, Bruce A. CraigPublisher:W. H. Freeman