Concept explainers
Videos
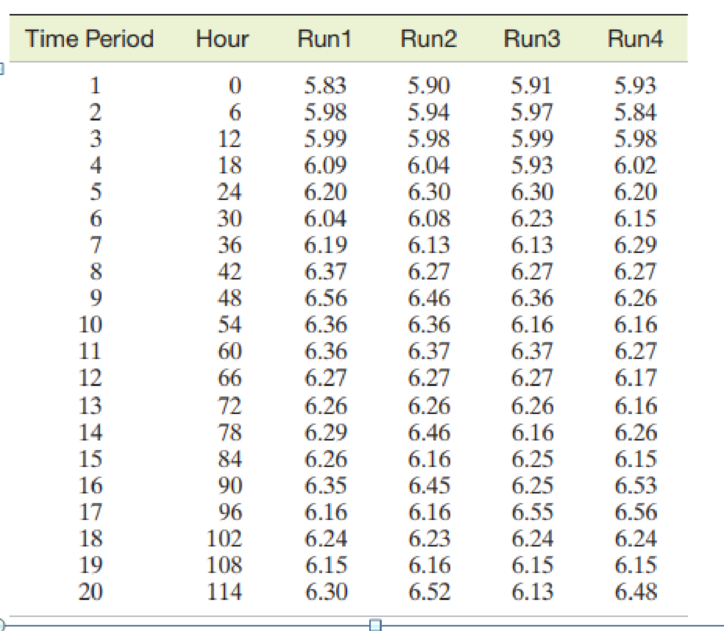
Bioreactor production of antibodies. Benchtop bioreactors are used to produce antibodies for anti-cancer drugs. Engineers calibrate bioreactors in order to maximize production. The African Journal of Biotechnology (December 2011) published a study designed to achieve a high percentage of antibody production from a bioreactor. The variable of interest was the natural logarithm of the number of viable cells produced in a bioreactor run. Data were collected for a sample of four bioreactor runs every 6 hours for 20 consecutive time periods. These data (simulated from information provided in the article) are listed in the accompanying table. Engineers have specified the following for the bioreactor runs: target mean = 6.3, LSL = 5.9, and USL = 6.5. Run a complete capability analysis on the data. How would you categorize the performance of the process?
Want to see the full answer?
Check out a sample textbook solution
Chapter 13 Solutions
Statistics Plus New MyLab Statistics with Pearson eText -- Access Card Package (13th Edition)


- What might a scatterplot of data points look like if it were best described by a logarithmic model?arrow_forwardWhat does the y -intercept on the graph of a logistic equation correspond to for a population modeled by that equation?arrow_forwardSales of a video game released in the year 2000 took off at first, but then steadily slowed as time moved on. Table 4 shows the number of games sold, in thousands, from the years 20002010. a. Let x represent time in years starting with x=1 for the year 2000. Let y represent the number of games sold in thousands. Use logarithmic regression to fit a model to these data. b. If games continue to sell at this rate, how many games will sell in 2015? Round to the nearest thousand.arrow_forward
- What situations are best modeled by a logistic equation? Give an example, and state a case for why the example is a good fit.arrow_forwardWith what kind of exponential model would half-life be associated? What role does half-life play in these models?arrow_forwardEnter the data from Table 2 into a graphing calculator and graph the ranking scatter plot. Determine whetherthe data from the table would likely represent a function that is linear, exponential, or logarithmic.arrow_forward
- Explain why the values of an increasing exponentialfunction will eventually overtake the valuesof anincreasing linear function.arrow_forwardWhat is the y -intercept of the logistic growth model y=c1+aerx ? Show the steps for calculation. What does this point tell us about the population?arrow_forwardWith what kind of exponential model would doubling time be associated? What role does doubling time play in these models?arrow_forward
 College Algebra (MindTap Course List)AlgebraISBN:9781305652231Author:R. David Gustafson, Jeff HughesPublisher:Cengage Learning
 Glencoe Algebra 1, Student Edition, 9780079039897...AlgebraISBN:9780079039897Author:CarterPublisher:McGraw Hill
 Algebra and Trigonometry (MindTap Course List)AlgebraISBN:9781305071742Author:James Stewart, Lothar Redlin, Saleem WatsonPublisher:Cengage Learning