ETSU PRACSTAT + SAP ACESS 12MO (LL)
8th Edition
ISBN: 9781319226145
Author: Moore
Publisher: Macmillan Higher Education
bartleby

Concept explainers

bartleby

Videos

Question
Book Icon
Chapter 1.4, Problem 104E

(a)

To determine

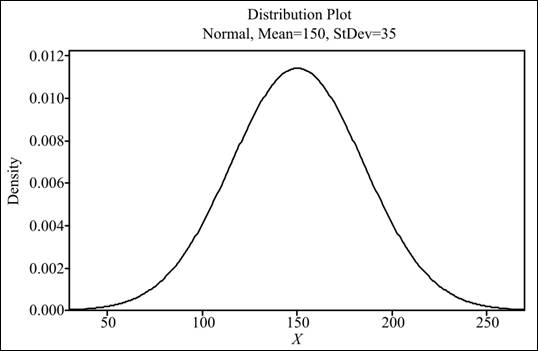
To graph: The normal curve.

(a)

Expert Solution
Check Mark

Explanation of Solution

Graph: The normal curve can be obtained by using the Minitab software. Follow the steps given below:

Step 1: Enter the data in the Minitab worksheet.

Step 2: Go to Graph and then select the option ‘probability distribution plot.’ Then, select View single. Click on Ok.

Step 3: Enter the value of 150 in mean and 35 in standard deviation, and click on Ok.

The normal curve can be obtained as:

ETSU PRACSTAT + SAP ACESS 12MO (LL), Chapter 1.4, Problem 104E , additional homework tip  1

(b)

To determine

To find: The table for values of scores corresponds to the standard deviation from the mean.

(b)

Expert Solution
Check Mark

Answer to Problem 104E

Solution: The required table can be shown below:

Lower limit

Upper limit

150±35

115

185

150±(2×35)

80

220

150±(3×35)

45

255

Explanation of Solution

Calculation: The table corresponding to values of scores for the standard deviation deviating from mean can be seen as done below:

Lower limit

Upper limit

μ±σ=150±35

μσ=15035=115

μ+σ=150+35=185

μ±2σ=150±(2×35)

μ2σ=150(2×35)=80

μ+2σ=150+(2×35)=220

μ±3σ=150±(3×35)

μ3σ=150(3×35)=45

μ+3σ=150+(3×35)=255

To determine

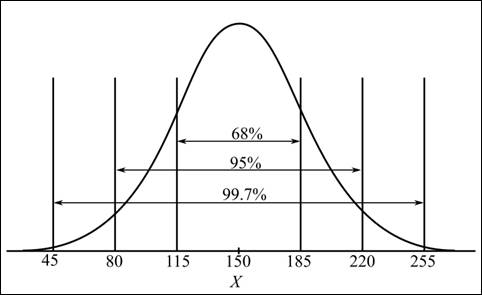
To graph: The sketch for the points calculated above.

Expert Solution
Check Mark

Explanation of Solution

Graph: The lower limits and upper limits were calculated above. The sketch of these points can be made using the 689599.7 rule.

The diagram can be seen as below:

ETSU PRACSTAT + SAP ACESS 12MO (LL), Chapter 1.4, Problem 104E , additional homework tip  2

(c)

To determine

To find: The range of reading scores using the 689599.7 rule.

(c)

Expert Solution
Check Mark

Answer to Problem 104E

Solution: The range of reading scores are (115,185)_, (80,220)_, and (45,225)_.

Explanation of Solution

Calculation: The 689599.7 rule states that in the normal distribution, 68% of data falls under (μ±σ), 95% of the data falls under (μ±2σ), and 99.7% of the data falls under (μ±3σ).

With the given values of mean and standard deviation, the range of reading score value for the students can be obtained by the steps below:

Step 1: For calculating 68% of data,

μ±σ=(μσ,μ+σ)=(15035,150+35)=(115,185)

Step 2: For calculating 95% of data,

μ±2σ=(μ2σ,μ+2σ)=(15070,150+70)=(80,220)

Step 3: For calculating 99.7% of data,

μ±3σ=(μ3σ,μ+3σ)=(150105,150+105)=(45,225)

Want to see more full solutions like this?

Subscribe now to access step-by-step solutions to millions of textbook problems written by subject matter experts!

Chapter 1 Solutions

ETSU PRACSTAT + SAP ACESS 12MO (LL)

Ch. 1.1 - Prob. 11ECh. 1.1 - Prob. 12ECh. 1.1 - Prob. 13ECh. 1.1 - Prob. 14ECh. 1.1 - Prob. 15ECh. 1.2 - Prob. 16UYKCh. 1.2 - Prob. 17UYKCh. 1.2 - Prob. 18UYKCh. 1.2 - Prob. 19UYKCh. 1.2 - Prob. 20UYKCh. 1.2 - Prob. 21UYKCh. 1.2 - Prob. 22UYKCh. 1.2 - Prob. 23UYKCh. 1.2 - Prob. 24UYKCh. 1.2 - Prob. 25ECh. 1.2 - Prob. 26ECh. 1.2 - Prob. 27ECh. 1.2 - Prob. 28ECh. 1.2 - Prob. 29ECh. 1.2 - Prob. 30ECh. 1.2 - Prob. 31ECh. 1.2 - Prob. 32ECh. 1.2 - Prob. 33ECh. 1.2 - Prob. 34ECh. 1.2 - Prob. 35ECh. 1.2 - Prob. 36ECh. 1.2 - Prob. 37ECh. 1.2 - Prob. 38ECh. 1.2 - Prob. 39ECh. 1.2 - Prob. 40ECh. 1.2 - Prob. 41ECh. 1.2 - Prob. 42ECh. 1.3 - Prob. 43UYKCh. 1.3 - Prob. 44UYKCh. 1.3 - Prob. 45UYKCh. 1.3 - Prob. 46UYKCh. 1.3 - Prob. 47UYKCh. 1.3 - Prob. 48UYKCh. 1.3 - Prob. 49UYKCh. 1.3 - Prob. 50UYKCh. 1.3 - Prob. 51UYKCh. 1.3 - Prob. 52UYKCh. 1.3 - Prob. 53UYKCh. 1.3 - Prob. 54UYKCh. 1.3 - Prob. 55UYKCh. 1.3 - Prob. 56UYKCh. 1.3 - Prob. 57ECh. 1.3 - Prob. 58ECh. 1.3 - Prob. 59ECh. 1.3 - Prob. 60ECh. 1.3 - Prob. 61ECh. 1.3 - Prob. 62ECh. 1.3 - Prob. 63ECh. 1.3 - Prob. 64ECh. 1.3 - Prob. 65ECh. 1.3 - Prob. 66ECh. 1.3 - Prob. 67ECh. 1.3 - Prob. 68ECh. 1.3 - Prob. 69ECh. 1.3 - Prob. 70ECh. 1.3 - Prob. 71ECh. 1.3 - Prob. 72ECh. 1.3 - Prob. 73ECh. 1.3 - Prob. 74ECh. 1.3 - Prob. 75ECh. 1.3 - Prob. 76ECh. 1.3 - Prob. 77ECh. 1.3 - Prob. 78ECh. 1.3 - Prob. 79ECh. 1.3 - Prob. 80ECh. 1.3 - Prob. 81ECh. 1.3 - Prob. 82ECh. 1.3 - Prob. 83ECh. 1.3 - Prob. 84ECh. 1.3 - Prob. 85ECh. 1.3 - Prob. 86ECh. 1.3 - Prob. 87ECh. 1.3 - Prob. 88ECh. 1.3 - Prob. 89ECh. 1.3 - Prob. 90ECh. 1.3 - Prob. 91ECh. 1.3 - Prob. 92ECh. 1.4 - Prob. 93UYKCh. 1.4 - Prob. 94UYKCh. 1.4 - Prob. 95UYKCh. 1.4 - Prob. 96UYKCh. 1.4 - Prob. 97UYKCh. 1.4 - Prob. 98UYKCh. 1.4 - Prob. 99UYKCh. 1.4 - Prob. 100UYKCh. 1.4 - Prob. 101ECh. 1.4 - Prob. 102ECh. 1.4 - Prob. 103ECh. 1.4 - Prob. 104ECh. 1.4 - Prob. 105ECh. 1.4 - Prob. 106ECh. 1.4 - Prob. 107ECh. 1.4 - Prob. 108ECh. 1.4 - Prob. 109ECh. 1.4 - Prob. 110ECh. 1.4 - Prob. 111ECh. 1.4 - Prob. 112ECh. 1.4 - Prob. 113ECh. 1.4 - Prob. 114ECh. 1.4 - Prob. 115ECh. 1.4 - Prob. 116ECh. 1.4 - Prob. 117ECh. 1.4 - Prob. 118ECh. 1.4 - Prob. 119ECh. 1.4 - Prob. 120ECh. 1.4 - Prob. 121ECh. 1.4 - Prob. 122ECh. 1.4 - Prob. 123ECh. 1.4 - Prob. 124ECh. 1.4 - Prob. 125ECh. 1.4 - Prob. 126ECh. 1.4 - Prob. 127ECh. 1.4 - Prob. 128ECh. 1.4 - Prob. 129ECh. 1.4 - Prob. 130ECh. 1.4 - Prob. 131ECh. 1.4 - Prob. 132ECh. 1.4 - Prob. 133ECh. 1.4 - Prob. 134ECh. 1.4 - Prob. 135ECh. 1.4 - Prob. 136ECh. 1.4 - Prob. 137ECh. 1.4 - Prob. 138ECh. 1.4 - Prob. 139ECh. 1.4 - Prob. 140ECh. 1.4 - Prob. 141ECh. 1.4 - Prob. 142ECh. 1.4 - Prob. 143ECh. 1.4 - Prob. 144ECh. 1 - Prob. 145ECh. 1 - Prob. 146ECh. 1 - Prob. 147ECh. 1 - Prob. 148ECh. 1 - Prob. 149ECh. 1 - Prob. 150ECh. 1 - Prob. 151ECh. 1 - Prob. 152ECh. 1 - Prob. 153ECh. 1 - Prob. 154ECh. 1 - Prob. 155ECh. 1 - Prob. 156ECh. 1 - Prob. 157ECh. 1 - Prob. 158ECh. 1 - Prob. 159ECh. 1 - Prob. 160ECh. 1 - Prob. 161ECh. 1 - Prob. 162ECh. 1 - Prob. 163ECh. 1 - Prob. 164ECh. 1 - Prob. 165ECh. 1 - Prob. 166ECh. 1 - Prob. 167ECh. 1 - Prob. 168E
Knowledge Booster
Background pattern image
Statistics
Learn more about
Need a deep-dive on the concept behind this application? Look no further. Learn more about this topic, statistics and related others by exploring similar questions and additional content below.
Recommended textbooks for you
Text book image
MATLAB: An Introduction with Applications
Statistics
ISBN:9781119256830
Author:Amos Gilat
Publisher:John Wiley & Sons Inc
Text book image
Probability and Statistics for Engineering and th...
Statistics
ISBN:9781305251809
Author:Jay L. Devore
Publisher:Cengage Learning
Text book image
Statistics for The Behavioral Sciences (MindTap C...
Statistics
ISBN:9781305504912
Author:Frederick J Gravetter, Larry B. Wallnau
Publisher:Cengage Learning
Text book image
Elementary Statistics: Picturing the World (7th E...
Statistics
ISBN:9780134683416
Author:Ron Larson, Betsy Farber
Publisher:PEARSON
Text book image
The Basic Practice of Statistics
Statistics
ISBN:9781319042578
Author:David S. Moore, William I. Notz, Michael A. Fligner
Publisher:W. H. Freeman
Text book image
Introduction to the Practice of Statistics
Statistics
ISBN:9781319013387
Author:David S. Moore, George P. McCabe, Bruce A. Craig
Publisher:W. H. Freeman
Statistics 4.1 Point Estimators; Author: Dr. Jack L. Jackson II;https://www.youtube.com/watch?v=2MrI0J8XCEE;License: Standard YouTube License, CC-BY
Statistics 101: Point Estimators; Author: Brandon Foltz;https://www.youtube.com/watch?v=4v41z3HwLaM;License: Standard YouTube License, CC-BY
Central limit theorem; Author: 365 Data Science;https://www.youtube.com/watch?v=b5xQmk9veZ4;License: Standard YouTube License, CC-BY
Point Estimate Definition & Example; Author: Prof. Essa;https://www.youtube.com/watch?v=OTVwtvQmSn0;License: Standard Youtube License
Point Estimation; Author: Vamsidhar Ambatipudi;https://www.youtube.com/watch?v=flqhlM2bZWc;License: Standard Youtube License