
ELEMENTARY STATISTICS-W/ACCESS >CUSTOM<
3rd Edition
ISBN: 9781323594889
Author: Triola
Publisher: PEARSON C
expand_more
expand_more
format_list_bulleted
Videos
Textbook Question
Chapter 14, Problem 10CRE
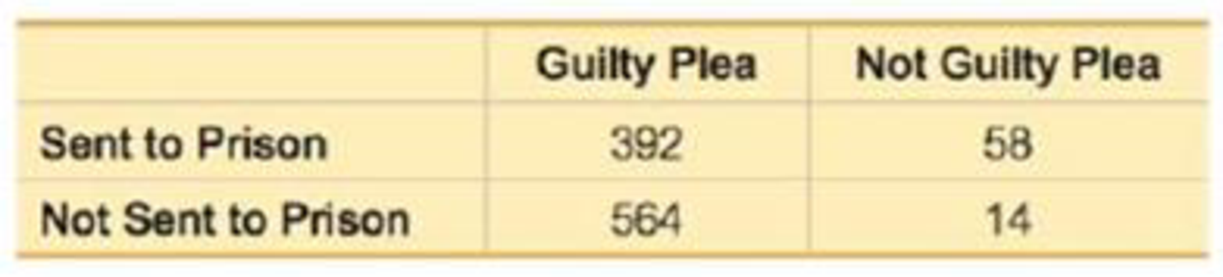
Does It Pay to Plead Guilty? The accompanying table summarizes randomly selected sample data for San Francisco defendants in burglary cases (based on data from “Does It Pay to Plead Guilty? Differential Sentencing and the
Expert Solution & Answer
Want to see the full answer?
Check out a sample textbook solution
Students have asked these similar questions
Does It Pay to Plead Guilty? The accompanying table summarizes randomly selected sample data for San Francisco defendants in burglary cases (based on data from “Does It Pay to Plead Guilty? Differential Sentencing and the Functioning of the Criminal Courts,” by Brereton and Casper, Law and Society Review, Vol. 16, No. 1). All of the subjects had prior prison sentences. Use a 0.05 significance level to test the claim that the sentence (sent to prison or not sent to prison) is independent of the plea. If you were an attorney defending a guilty defendant, would these results suggest that you should encourage a guilty plea?
Independent random samples of 32 people living on the west side of a city and 30 people living on the east side of a city were taken to determine if the income levels of west side residents are significantly different from the income levels of east side residents. Given the testing statistics below, determine if the data provides sufficient evidence to conclude that the income levels of west side residents are significantly different from the income levels of east side residents, at the 2% significance level.
H0:μw=μeHa:μw≠μe
t0=2.364
t0.01=±2.099
Select the correct answer below:
No; the test statistic is not between the critical values.
No; the test statistic is between the critical values.
Yes; the test statistic is not between the critical values.
Yes; the test statistic is between the critical values.
In a study to determine if using low-intensity laser therapy reduces pain for orthodontic patients who are fitted with new braces, patients were randomly assigned to either a control group (who did not receive laser treatment) or an experimental group who did receive laser treatment.† The researchers found that the mean pain rating was lower for those in the laser treatment group than for those in the control group both two days and six days after receiving braces. The researchers used these data to determine if there was evidence to support the claim that the mean pain rating is lower for patients who receive the laser treatment.
Answer the four key questions.
Q, Question Type: Estimation or hypothesis testing?
estimationhypothesis testing
S, Study Type: Sample data or experiment data?
sample dataexperiment data
T, Type of Data: One variable or two? Categorical or numerical?
one categorical variableone numerical variable two categorical variablestwo numerical variables…
Chapter 14 Solutions
ELEMENTARY STATISTICS-W/ACCESS >CUSTOM<
Ch. 14.1 - FAA Requirement Table 14-1 on page 655 lists...Ch. 14.1 - Prob. 2BSCCh. 14.1 - Prob. 3BSCCh. 14.1 - Prob. 4BSCCh. 14.1 - Prob. 5BSCCh. 14.1 - Prob. 6BSCCh. 14.1 - Prob. 7BSCCh. 14.1 - Pepsi Cans. In Exercises 5-8, refer to the axial...Ch. 14.1 - Prob. 9BSCCh. 14.1 - Prob. 10BSC
Ch. 14.1 - Quarters. In Exercises 9-12, refer to the...Ch. 14.1 - Prob. 12BSCCh. 14.1 - Prob. 13BBCh. 14.1 - Prob. 14BBCh. 14.2 - Statistical Literacy and Critical Thinking 1....Ch. 14.2 - Prob. 2BSCCh. 14.2 - Control Limits In constructing a control chart for...Ch. 14.2 - Euro Coins After constructing a control chart for...Ch. 14.2 - Control Charts for p. In Exercises 5-12, use the...Ch. 14.2 - Control Charts for p. In Exercises 5-12, use the...Ch. 14.2 - Prob. 7BSCCh. 14.2 - Control Charts for p. In Exercises 5-12, use the...Ch. 14.2 - Control Charts for p. In Exercises 5-12, use the...Ch. 14.2 - Control Charts for p. In Exercises 5-12, use the...Ch. 14.2 - Control Charts for p. In Exercises 5-12, use the...Ch. 14.2 - Control Charts for p. In Exercises 5-12, use the...Ch. 14.2 - Prob. 13BBCh. 14 - What are process data?Ch. 14 - Prob. 2CQQCh. 14 - Prob. 3CQQCh. 14 - Prob. 4CQQCh. 14 - Prob. 5CQQCh. 14 - Prob. 6CQQCh. 14 - Prob. 7CQQCh. 14 - Prob. 8CQQCh. 14 - Prob. 9CQQCh. 14 - Prob. 10CQQCh. 14 - Prob. 1RECh. 14 - Prob. 2RECh. 14 - Prob. 3RECh. 14 - Energy Consumption. Exercises 15 refer to the...Ch. 14 - Prob. 5RECh. 14 - Prob. 1CRECh. 14 - Prob. 2CRECh. 14 - Prob. 3CRECh. 14 - Internet Doctors: Probability Based on the survey...Ch. 14 - Sunspots and the DJIA Listed below are annual...Ch. 14 - Prob. 6CRECh. 14 - Prob. 7CRECh. 14 - Defective Child Restraint Systems The Tracolyte...Ch. 14 - Prob. 9CRECh. 14 - Does It Pay to Plead Guilty? The accompanying...Ch. 14 - FROM DATA TO DECISION Critical Thinking: Are the...
Knowledge Booster


Learn more about
Need a deep-dive on the concept behind this application? Look no further. Learn more about this topic, statistics and related others by exploring similar questions and additional content below.Similar questions
- What is meant by the sample space of an experiment?arrow_forwardWhat is an experiment?arrow_forwardIndependent random samples of 31 people living on the west side of a city and 25 people living on the east side of a city were taken to determine if the income levels of west side residents are greater than the income levels of east side residents. Given the testing statistics below, determine if the data provides sufficient evidence to conclude that the income levels of west side residents are greater than the income levels of east side residents, at the 2% significance level. H0:μw≤μeHa:μw>μe t0=0.511 t0.02=2.104 Select the correct answer below: Yes; the test statistic is greater than the critical value. No; the test statistic is greater than the critical value. No; the test statistic is less than the critical value. Yes; the test statistic is less than the critical value.arrow_forward
- Does St. John wort (an herb) have a siginifact effect in treating major depression? A study looked at 340 adult outpatients suffering as measured by their HAM-Dscore, randomly assiging each subject to either a placebo, St.John's wort, or a second active treatment for comparison. The study found the diiference in treating major depression as measured by improvement in HAM-D scores between St.John's wort and the placebo was not statistically significant This means that: A. a difference this big could easily occur just by chance even if St. John's wort does not better than the placebo B. We cannot make a 95 percent confidence statement C.The placebo makes no difference in the subjects' depression D. The study was badly designedarrow_forwardAre low-fat diets or low-carb diets more effective for weight loss? This question was addressed in the article “Comparison of the Atkins, Zone, Ornish, and LEARN Diets for Change in Weight and Related Risk Factors Among Overweight Premenopausal Women: The A TO Z Weight Loss Study: A Randomized Trial” (C. Gardner, A. Kiazand, et al., Journal of the American Medical Association, 2007:969–977). A sample of 77 subjects went on a low-carbohydrate diet for six months. At the end of that time the sample mean weight loss was 4.7 kg with a sample standard deviation of 7.2 kg. A second sample of 79 subjects went on a low-fat diet. Their sample mean weight loss was 2.6 kg with a standard deviation of 5.9 kg. a) Can you conclude that the mean weight loss is greater for those on the low-carbohydrate diet? b) Can you conclude that the mean weight loss on the low-carbohydrate diet is more than 1 kg greater than that of the low-fat diet?arrow_forwardIn order to investigate a claim that the average time required for the county fire department to respond to a reported fire is greater than 15 minutes, county staff determined the response times for 40 randomly selected fire reports. The data was used to test H0H0: μ = 15 versus HaHa: μ > 15 and the computed P‐value was 0.12. If a 0.05 level of significance is used, what conclusions can be drawn? There is convincing evidence that the mean response time is 15 minutes (or less). There is convincing evidence that the mean response time is greater than 15 minutes. There is not convincing evidence that the mean response time is greater than 15 minutes.arrow_forward
arrow_back_ios
arrow_forward_ios
Recommended textbooks for you
 Glencoe Algebra 1, Student Edition, 9780079039897...AlgebraISBN:9780079039897Author:CarterPublisher:McGraw Hill
 College Algebra (MindTap Course List)AlgebraISBN:9781305652231Author:R. David Gustafson, Jeff HughesPublisher:Cengage Learning
Glencoe Algebra 1, Student Edition, 9780079039897...
Algebra
ISBN:9780079039897
Author:Carter
Publisher:McGraw Hill
College Algebra (MindTap Course List)
Algebra
ISBN:9781305652231
Author:R. David Gustafson, Jeff Hughes
Publisher:Cengage Learning
Chi Square test; Author: Vectors Academy;https://www.youtube.com/watch?v=f53nXHoMXx4;License: Standard YouTube License, CC-BY