Subpart (a):
Calculate the marginal cost, average total cost , variable cost and total cost.
Subpart (a):
Explanation of Solution
Table -1 shows the value of the
Table -1
| Quantity | Average variable cost |
| 1 | 1 |
| 2 | 2 |
| 3 | 3 |
| 4 | 4 |
| 5 | 5 |
| 6 | 6 |
The variable cost can be calculated by using the following formula:
Substitute the respective values in Equation (1) to calculate the variable cost.
Thus, the variable cost is $1.
Table -2 shows the value of the variable cost obtained by using Equation (1).
Table -2
| Quantity | Average variable cost | Variable cost |
| 1 | 1 | 1 |
| 2 | 2 | 4 |
| 3 | 3 | 9 |
| 4 | 4 | 16 |
| 5 | 5 | 25 |
| 6 | 6 | 36 |
The total cost can be calculated by using the following formula:
Substitute the respective values in Equation (2) to calculate the total cost.
Thus, the total cost is $17.
Table -3 shows the value of the total cost obtained by using Equation (2).
Table – 3
| Quantity | Average variable cost | Variable cost | Total cost |
| 1 | 1 | 1 | 17 |
| 2 | 2 | 4 | 20 |
| 3 | 3 | 9 | 25 |
| 4 | 4 | 16 | 32 |
| 5 | 5 | 25 | 41 |
| 6 | 6 | 36 | 52 |
The marginal cost can be calculated by using the following formula:
Substitute the respective values in Equation (3) to calculate the marginal cost.
Thus, the marginal cost is $3.
Table -4 shows the value of the marginal cost obtained by using Equation (3).
Table -4
| Quantity | Average variable cost | Variable cost | Total cost | Marginal cost |
| 1 | 1 | 1 | 17 | – |
| 2 | 2 | 4 | 20 | 3 |
| 3 | 3 | 9 | 25 | 5 |
| 4 | 4 | 16 | 32 | 7 |
| 5 | 5 | 25 | 41 | 9 |
| 6 | 6 | 36 | 52 | 11 |
The average total cost can be calculated by using the following formula:
Substitute the respective values in Equation (4) to calculate the average total cost.
Thus, the average total cost is $17.
Table -5 shows the value of the average total cost obtained by using Equation (4).
Table -5
| Quantity | Average variable cost | Variable cost | Total cost | Marginal cost | Average total cost |
| 1 | 1 | 1 | 17 | – | 17 |
| 2 | 2 | 4 | 20 | 3 | 10 |
| 3 | 3 | 9 | 25 | 5 | 8.33 |
| 4 | 4 | 16 | 32 | 7 | 8 |
| 5 | 5 | 25 | 41 | 9 | 8.20 |
| 6 | 6 | 36 | 52 | 11 | 8.67 |
Concept introduction:
Marginal cost: Marginal cost refers to the additional cost incurred from producing one more additional unit of output.
Average total cost: The average total cost is the total cost per unit of the output produced by a firm.
Average variable cost: Average variable cost refers to the variable cost per unit.
Average total cost: Average total cost refers to the total cost per unit.
Subpart (b):
Total supply in the market.
Subpart (b):
Explanation of Solution
Suppose the
Concept introduction:
Supply: Supply refers to the total value of the goods and services that are available for the purchase at a particular price in a given period of time.
Subpart (c):
Long run profit.
Subpart (c):
Explanation of Solution
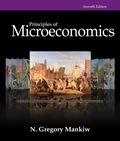
In the long-run, a firm can enter or exit the market. In this transition, when a firm enters the market, price will still fall at the minimum average total cost. Since the market price is $10, which is higher than the minimum of the average total cost of $8. So, the new firm’s entry will result in a decrease in the price level. When the price decreases, the quantity demand will increase. Also, the quantity of the supply decreases because the newly entered firm will continue to produce only when the price equals the average total cost. So, beyond that equilibrium state the firm will produce zero
Concept introduction:
Long run: Thelong run refers to the time, which changes the production variable to adjust to the market situation.
Subpart (d):
Long run supply.
Subpart (d):
Explanation of Solution
Figure – 1 shows the long-run supply curve for the market.
From the above figure, the x-axis represents the quantity of output and the y-axis represents the price and cost.
Concept introduction:
Supply: Supply refers to the total value of the goods and services that are available for the purchase at a particular price in a given period of time.
Want to see more full solutions like this?
Chapter 14 Solutions
Principles of Microeconomics

- Suppose that the development of a new drought-resistant hybrid seed corn leads to a 50 percent increase in the average yield per acre without increasing the cost to the farmers who use the new technology. If the producers in the corn production industry were price takers, what would happen to the following? a. the price of corn b. the profitability of corn farmers who quickly adopt the new technology c. the profitability of corn farmers who are slow to adopt the new technology d. the price of soybeans, a substitute product for cornarrow_forwardTable showing Market Demand Price Quantity Demanded Quantity Supplied $90 20 $65 30 $45 40 $35 50 $25 60 $15 70 $10 80 What is the equilibrium price and quantity given this information on demand in the market? Is each firm making a profit or loss? What is the amount of that profit or loss? What do you predict will happen over the long run? What if the information regarding market demand and market supply is conveyed in equations rather than tables? Practice how you would find equilibrium in a competitive market using equations for demand and supply. Suppose in a competitive market the market demand can be represented as follows: P=10−Q(andthusQ=10−P) and that market supply can be represented as follows: P=Q. Using the fact that at equilibrium the quantity demanded equals the quantity supplied, find the equilibrium price and quantity in this market.arrow_forwardConsider a perfectly newspaper market with identical firms, each with the usual shaped cost curves. (1) The government imposes a (permanent) $2 per-newspaper subsidy on the market. What is the impact of the subsidy on the newspaper market? Make sure to distinguish between the short-run and the long-run impacts. (2) If demand permanently decreases, what is the impact on the newspaper market? Make sure to distinguish between the short-run and the long-run impacts.arrow_forward
- In Problem 5, the market demand decreases and the demand schedule becomes: If firms have the same costs set out in Problem 5, what is the market price and the firm’s economic profit or loss in the short run? Problem 5 The market for paper is perfectly competitive and 1,000 firms produce paper. The table sets out the market demand schedule for paper. The table in the next column sets out the costs of each producer of paper. Calculate the market price, the market output, the quantity produced by each firm, and the firm’s economic profit or loss.arrow_forwardassume fresh vegetable market is perfectly competitive and a typical farmer was break-even prior to the price changes. explain and illustrate graphically, the effect of change in price on the short-run position of an individual farm whose crops have not been affected by the flood. explain and illustrate the long run position for a typical farmer.arrow_forwardSuppose the competitive market price is $60, and a competitive firm’s total costs = q^2 - 6q + 990 and marginal cost = 2q - 6. a. Solve for the profit-maximizing (or loss minimizing) quantity (q*). b. What is the market equilibrium price? c. Should the competitive firm produce q*? Explain why using one of the four key questions and solutions. d. Does the competitive firm make a profit? Explain why using one of the four key questions and solutions. e. How much profit (or loss) does the competitive firm make?arrow_forward
- The shapes of firms' cost curves are important because they help us determine how the firm will produce. cost curves tell us the profitability of the firm. cost curves give us an idea of what a firm's total revenues will be at different output levels. they help us understand the market that the firm is in.arrow_forwardMarginal cost= 2x+3 Average variable cost= x+3 Variable cost=x^2 + 3x x is the daily output. Product's price is 13 dollars. Part a) Calculate the level of output that will be produced. Part b) Calculate the producer surplus of the firm. Part c) The fixed costs are 5 dollars. In the short run, is the firm making a 0 economic profit, a positive profit, or a negative profit? Explain why.arrow_forwardA profit-maximizing firm in a competitive market is currently producing 100 units of output. It has average revenue of $10, average total cost of $8, and fixed cost of $200. What is its profit? What is its marginal cost? What is its average variable cost?arrow_forward
- Instructions: Answer to the best of your ability. Show all of your work, the details, excel tab. The Market for Good X is perfectly competitive, with market supply and own-price demand curves given as q_s=-25000 + 3000p q_d=135000-5000p a. Determine the equilibrium price and quantity in the market for good x. (Note: You are not anlayzing an individual firm here. You are analyzing the entire market). Suppose the individual firm's average total costs are dfined by TC=1/3q^3-3q^2+28q+2 b. What is the firm's demand curve (don't give me back the industry demand curve. The firm's demand curve is what I want.) c. find the profit maximizing level of output for the firm (I've given the marginal cost curve below). MC=q^2-6q+28 d. If this firm is making a profit (loss) how much is the profit (loss)?arrow_forwardThe market for fertilizer is perfectly competitive. Firms in the market are producing output but are currently incurring economic losses. a. How does the price of fertilizer compare to the average total cost, the average variable cost, and the marginal cost of producing fertilizer? b. Draw two graphs, side by side, illustrating the present situation for the typical firm and for the market. [Upload a picture] c. Assuming there is no change in either demand or the firms’ cost curves, explain what will happen in the long run to the price of fertilizer, marginal cost, average total cost, the quantity supplied by each firm, and the total quantity supplied to the marketarrow_forward. The market for apples is perfectly competitive and currently has 400 identical firms. Each firm has fixed costs of $16 and average variable costs given below: Quantity Average Variable Cost 1 $1 2 $2 3 $3 4 $4 5 $5 6 $6 7 $7 a) The equilibrium price is currently $11. How much does each firm produce in order to profit maximize and what is the total quantity supplied in the market? b) As the market transitions to long-run equilibrium, will the price of app;es fall or will it rise? Explain.arrow_forward
 Essentials of Economics (MindTap Course List)EconomicsISBN:9781337091992Author:N. Gregory MankiwPublisher:Cengage Learning
 Economics: Private and Public Choice (MindTap Cou...EconomicsISBN:9781305506725Author:James D. Gwartney, Richard L. Stroup, Russell S. Sobel, David A. MacphersonPublisher:Cengage Learning
 Microeconomics: Private and Public Choice (MindTa...EconomicsISBN:9781305506893Author:James D. Gwartney, Richard L. Stroup, Russell S. Sobel, David A. MacphersonPublisher:Cengage Learning