
Customer profitability, customer-cost hierarchy. Enviro-Tech has only two retail and two wholesale customers. Information relating to each customer for 2017 follows (in thousands):
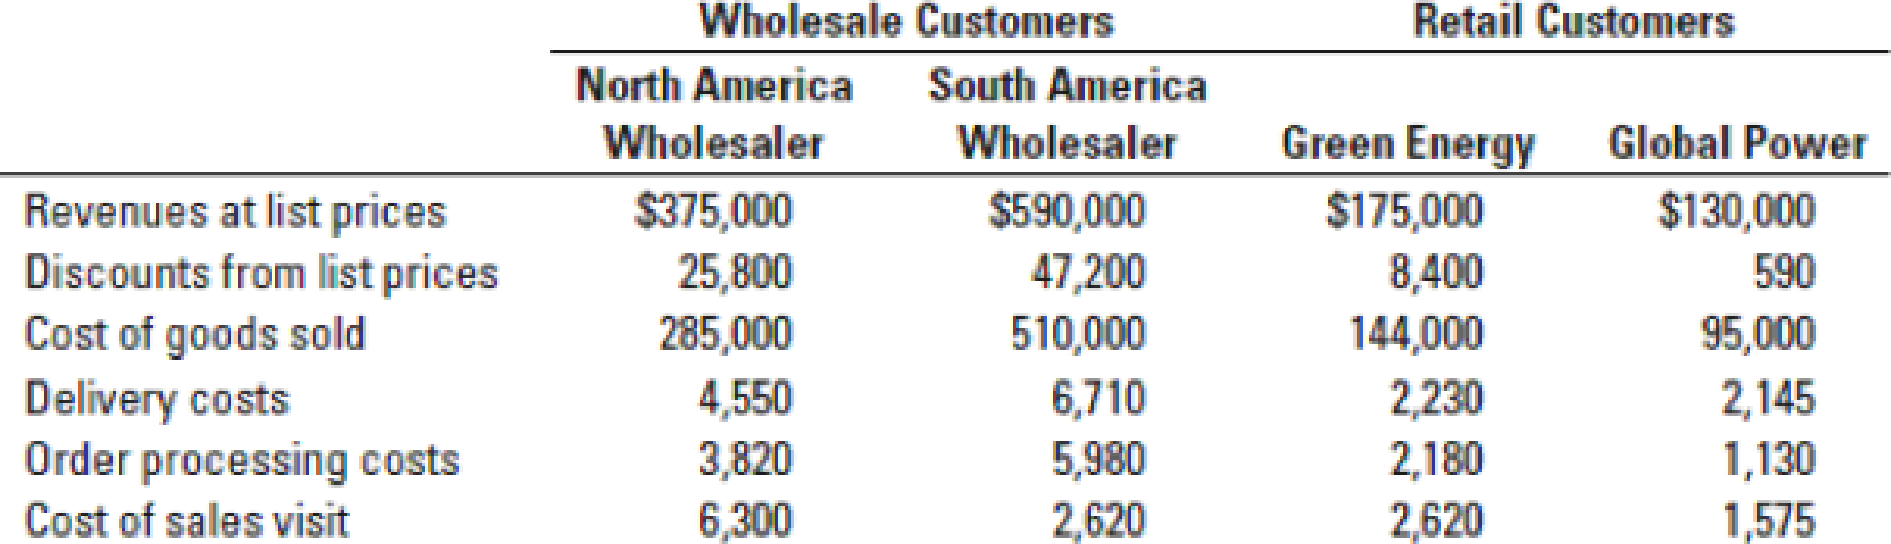
Enviro-Tech’s annual distribution-channel costs are $33 million for wholesale customers and $12 million for retail customers. The company’s annual corporate-sustaining costs, such as salary for top management and general-administration costs are $48 million. There is no cause-and-effect or benefits-received relationship between any cost-allocation base and corporate-sustaining costs. That is, Enviro-Tech could save corporate-sustaining costs only if the company completely shuts down.
- 1. Calculate customer-level operating income using the format in Figure 14-3.
Required
- 2. Prepare a customer-cost hierarchy report, using the format in Figure 14-6.
- 3. Enviro-Tech’s management decides to allocate all corporate-sustaining costs to distribution channels: $38 million to the wholesale channel and $10 million to the retail channel. As a result, distribution channel costs are now $71 million ($33 million + $38 million) for the wholesale channel and $22 million ($12 million + $10 million) for the retail channel. Calculate the distribution-channel-level operating income. On the basis of these calculations, what actions, if any, should Enviro-Tech’s managers take? Explain.
- 4. How might Enviro-Tech use the new cost information from its activity-based costing system to better manage its business?

Learn your wayIncludes step-by-step video

Chapter 14 Solutions
Horngren's Cost Accounting: A Managerial Emphasis (16th Edition)
Additional Business Textbook Solutions
Intermediate Accounting
Financial Accounting, Student Value Edition (5th Edition)
Horngren's Financial & Managerial Accounting, The Financial Chapters (6th Edition)
Financial Accounting (11th Edition)
Managerial Accounting (5th Edition)
Financial Accounting, Student Value Edition (4th Edition)

- Customer profitability, customer-cost hierarchy. Enviro-Tech has only two retail and two wholesale customers. Information relating to each customer for 2017 follows (in thousands): Wholesale Customers Retail Customers North America South America Wholesaler Wholesaler Green Energy Global Power Revenues at list prices Discounts from list prices Cost of goods sold Delivery costs Order processing costs $375,000 25,800 $590,000 $175,000 $130,000 47,200 8,400 590 285,000 510,000 144,000 95,000 2,230 2,180 4,550 6,710 2,145 3,820 5,980 1,130 Cost of sales visit 6,300 2,620 2,620 1,575 Enviro-Tech's annual distribution-channel costs are $33 million for wholesale customers and $12 million for retail customers. The company's annual corporate-sustaining costs, such as salary for top management and general- administration costs are $48 million. There is no cause-and-effect or benefits-received relationship between any cost- allocation base and corporate-sustaining costs. That is, Enviro-Tech could…arrow_forwardThe condensed income statement for the Consumer Products Division of Fargo Industries Inc. is as follows (assuming no service department charges): Sales $540,000 Cost of goods sold 243,000 Gross profit $297,000 Administrative expenses 135,000 Income from operations $162,000 The manager of the Consumer Products Division is considering ways to increase the return on investment. a. Using the DuPont formula for return on investment, determine the profit margin, investment turnover, and return on investment of the Consumer Products Division, assuming that $1,350,000 of assets have been invested in the Consumer Products Division. Round the investment turnover to one decimal place. Profit margin % Investment turnover Rate of return on investment % b. If expenses could be reduced by $27,000 without decreasing sales, what would be the impact on the profit margin, investment turnover, and return on investment for the Consumer Products Division? Round the investment…arrow_forward(Management Accounting) The following information is available for Kismer Corporation: Total fixed costs $313,500 Variable costs per unit $90 Selling price per unit $150 If management has a targeted net income of $59,400, then sales revenue should be ________. A) $239,721 B) $580,067 C) $671,220 D) $932,250arrow_forward
- Check m Bovine Company, a wholesale distributor of umbrellas, has been experiencing losses for some time, as shown by its most recent monthly contribution format income statement: Sales Variable expenses Contribution margin Fixed expenses $2,050,000 876,050 1,173,950 1,315,000 $ (141,050) Operating loss In an effort to isolate the problem, the president has asked for an income statement segmented by geographic market. Accordingly, the Accounting Department has developed the following: Geographic Market Central South North Sales Variable expenses as a percentage of sales Traceable fixed expenses $605,000 $804,000 $641,000 34% $315,000 $500,000 $305,000 53% 44% Required: 1. Prepare a contribution format income statement segmented by geographic market, as requested by the president Geographic Market Total South Central North Companyarrow_forwardSaunders Corporation manufactures consumer electronics products. Selected income statement data for 2009 and 2010 are provided in Table 5. P.S. The company is not operating at full capacity and therefore, fixed costs are not changing: Table 5 Selected Income Statement Items for Saunders Co. in million USD Saunders Corporation (amounts in millions of dollars) 2009 2010 Sales 8,296 8,871 Cost of Goods Sold (5,890) (6,290) Selling and Administrative Expenses (1,788) (1,714) Operating Income before Income Taxes 618 867 Calculate the variable-cost percentage of the cost of goods sold by dividing the change in cost of goods sold to change in sales between 2009 and 2010 and use it to determine the fixed and variable components of the cost of goods sold. Repeat the process in part (a) above to calculate the fixed and variable components of the selling and administrative expenses c. Saunders Corporation discloses that it expects sales to…arrow_forwardDhapaarrow_forward
- Patterson Company operates three segments. Income statements for the segments imply that profitability could be improved if Segment A were eliminated. PATTERSON COMPANY Income Statements for the Year 2014 Segment Sales Cost of goods sold А В C $164,000 $250,000 $245,000 (84,000) (29,000) |(130,000) (18,000) (80,000) (22,000) Sales commissions Contribution margin 143,000 16,000 137,000 General fixed oper. exp. (allocation of president's salary) Advertising expense (specific to individual divisions) (37,000) (32,000) (34,000) (5,000) (11,000) 0 (26,000) $ 94,000 $ 109,000 Net income Required: a. Prepare a schedule of relevant sales and costs for Segment A. Relevant Rev. and Cost items for Segment A Effect on income b. Prepare comparative income statements for the company as a whole under two alternatives: (1) the retention of Segment A and (2) the elimination of Segment A. PATTERSON COMPANY Comparative Income Statements for the Year 2014 Eliminate Seg. A Decision Keep Seg. A Sales Cost…arrow_forwardAnalyzing profitability Camden Company has divided its business into segments based on sales territories: East Coast, Midland, and West Coast. Following are financial data for 2018: Prepare an income statement for Camden Company for 2018 using the contribution margin format assuming total fixed costs for the company Were $435,000. Include columns for each business segment and a column for the total company.arrow_forwardPatterson Company operates three segments. Income statements for the segments imply that profitability could be improved if Segment A were eliminated. PATTERSON COMPANY Income Statements for the Year 2014 Segment Sales А В С $169,000 $243,000 $258,000 (80,000) (31,000) (121,000) (17,000) Cost of goods sold Sales commissions (88,000) (30,000) Contribution margin General fixed oper. exp. (allocation of president's salary) Advertising expense (specific to individual divisions) 132,000 31,000 140,000 (34,000) (48,000) (32,000) (6,000) (11,000) (9,000) $73,000 $108,000 Net income Required: a. Prepare a schedule of relevant sales and costs for Segment A. Relevant Rev. and Cost items for Segment A Effect on income b. Prepare comparative income statements for the company as a whole under two alternatives: (1) the retention of Segment A and (2) the elimination of Segment A. PATTERSON COMPANY Comparative Income Statements for the Year 2014 Eliminate Seg. A Keep Seg.A Decision Sales Cost of goods…arrow_forward
- CACI Shannon Company segments its income statement into its North and South Divisions. The company's overall sales, contribution margin ratio, and net operating income are $790,000, 48%, and $15,800, respectively. The North Division's contribution margin and contribution margin ratio are $150,800 and 52%, respectively. The South Division's segment margin is $95,000. The company has $150,100 of common fixed expenses that cannot be traced to either division. Required: Prepare an income statement for Shannon Company that uses the contribution format and is segmented by divisions. In addition, for the company as a whole and for each segment, show each item on the segmented income statements as a percent of sales. (Round your percentage answers to 1 decimal place (i.e. 0.1234 should be entered as 12.3).) Divisions Total Company North South Amount Amount Amount Sales Variable expenses Contribution margin Traceable fixed expenses Territorial segment margin Common fixed expenses Net operating…arrow_forwardAn analysis of the income statement of MERDEKA Corporation showed the following data on December 31, 2019 (all amounts in pesos): Sales Selling price per piece Variable costs and expenses Fixed costs and expenses 4,850,000 -25 -2,667,500 - 1,212,500 Using the above accounting information, solve for the answers to the following questions: How much is the contribution margin? How much is the net profit? How much is the breakeven sales? How much is number of units sold at break-even? How much is sales at target profit of 150% of current profit?|arrow_forwardPatterson Company operates three segments. Income statements for the segments imply that profitability could be improved if Segment A were eliminated. PATTERSON COMPANY Income Statements for the Year 2014 Segment Sales A В C $162,000 $242,000 $263,000 (84,000) (30,000) (80,000) (31,000) Cost of goods sold Sales commissions (128,000) (18,000) Contribution margin General fixed oper. exp. (allocation of president's salary) Advertising expense (specific to individual divisions) 16,000 128,000 152,000 (35,000) (39,000) (33,000) (3,000) (15,000) (26,000) $ 78,000 119,000 Net income Required: a. Prepare a schedule of relevant sales and costs for Segment A. Relevant Rev. and Cost items for Segment A Effect on income b. Prepare comparative income statements for the company as a whole under two alternatives: (1) the retention of Segment A and (2) the elimination of Segment A PATTERSON COMPANY Comparative Income Statements for the Year 2014 Eliminate Seg. A Keep Seg. A Decision Sales Cost of…arrow_forward

 AccountingAccountingISBN:9781337272094Author:WARREN, Carl S., Reeve, James M., Duchac, Jonathan E.Publisher:Cengage Learning,
 Accounting Information SystemsAccountingISBN:9781337619202Author:Hall, James A.Publisher:Cengage Learning,
 Horngren's Cost Accounting: A Managerial Emphasis...AccountingISBN:9780134475585Author:Srikant M. Datar, Madhav V. RajanPublisher:PEARSON
 Intermediate AccountingAccountingISBN:9781259722660Author:J. David Spiceland, Mark W. Nelson, Wayne M ThomasPublisher:McGraw-Hill Education
 Financial and Managerial AccountingAccountingISBN:9781259726705Author:John J Wild, Ken W. Shaw, Barbara Chiappetta Fundamental Accounting PrinciplesPublisher:McGraw-Hill Education