a)
To find: The standard deviation of the sampling distribution.
a)
Answer to Problem 14.1AYK
The standard deviation is 0.40.
Explanation of Solution
Given:
Population mean (µ)
Standard deviation (s) = 8
Calculation:
The standard deviation of the sampling distribution is calculated as:
Thus, the standard deviation is 0.40.
b)
To construct: A normal curve that explains the variability of  in many samples for the -provided population. Also, find the missing number using the 68-99-99.7 rule
b)
Explanation of Solution
Graph:
The figure could be constructed as: 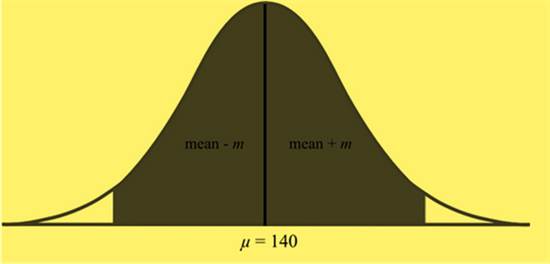
Calculation:
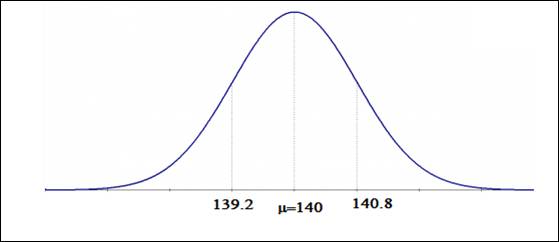
The margin of error could be constructed as:
The values of
Using these values, the figure is:
c)
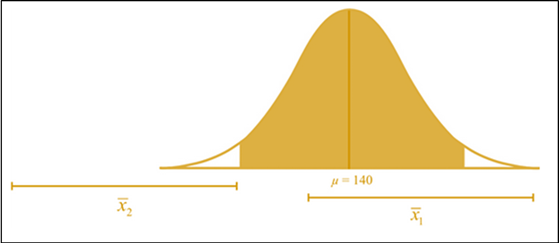
To construct: The interval below the sketch for one of
c)
Explanation of Solution
Graph:
The figure could be constructed as:
d)
To find: The percent of all samples would the confidence interval
d)
Answer to Problem 14.1AYK
The percentage is 95%.
Explanation of Solution
Calculation:
The percent of all the samples that would fall in the computed confidence interval is 95%. In this case, m is 0.8 and
Want to see more full solutions like this?
Chapter 14 Solutions
EBK PRACTICE OF STATISTICS IN THE LIFE

 MATLAB: An Introduction with ApplicationsStatisticsISBN:9781119256830Author:Amos GilatPublisher:John Wiley & Sons Inc
 Probability and Statistics for Engineering and th...StatisticsISBN:9781305251809Author:Jay L. DevorePublisher:Cengage Learning
 Statistics for The Behavioral Sciences (MindTap C...StatisticsISBN:9781305504912Author:Frederick J Gravetter, Larry B. WallnauPublisher:Cengage Learning
 Elementary Statistics: Picturing the World (7th E...StatisticsISBN:9780134683416Author:Ron Larson, Betsy FarberPublisher:PEARSON
 The Basic Practice of StatisticsStatisticsISBN:9781319042578Author:David S. Moore, William I. Notz, Michael A. FlignerPublisher:W. H. Freeman
 Introduction to the Practice of StatisticsStatisticsISBN:9781319013387Author:David S. Moore, George P. McCabe, Bruce A. CraigPublisher:W. H. Freeman