
(a)
The values of n and p.
(a)
Answer to Problem 14.25E
The value of n is 5 and value of p is 0.65.
Explanation of Solution
The given information is that the believer in the random walk theory of stock markets thinks that an index of stock prices has probability 0.65 of increasing in any year. X is the number of years among the next five years in which the index rises.
The binomial distribution formula is
Where, n is the number of trials, x is the number of successes among n trials, p is the probability of successes, and q is the probability of failure.
As given that X is a binomial probability distribution, n is the total number of observations and p is the probability of success. As given that the probability of increasing in any year is 0.65, which shows probability of success so p is 0.65. Also given that X is the number of years among the next five years in which the index rises, which means the number of observation is 5 years so the value of n is 5.
Thus, the value of n is 5 and value of p is 0.65.
(b)
The possible values that X can take.
(b)
Answer to Problem 14.25E
The possible values that X can take are
Explanation of Solution
As given in the question that X denotes the number of years in which the index rises. As there are 5 total number of years, so the set of possible values that X can take are:
It is because the value of X could be 0 when there is no index rises in any year and 5 when index rises in all 5 years, similarly all other values are possible. So the possible values that X can take are
Thus, the possible values that X can take are
(c)
To find: The probability of each value of X.
(c)
Answer to Problem 14.25E
The probabilities of each value of X are 0.00525, 0.04875, 0.18115, 0.33642, 0.31239 and 0.11603 for values of X as 0, 1, 2, 3, 4, and 5 respectively.
Explanation of Solution
The binomial distribution formula is
Where, n is the number of trials, x is the number of successes among n trials, p is the probability of successes, and q is the probability of failure.
As discussed in part (a) that the possible values that X can take are
Where k denotes number of events occur which is all possible sets, n denotes total number of events which is 5, p denotes probability of success which is 0.65 and q denotes probability of fail which is 0.35. Now substitute these values and k as 0 in the binomial probability formula then:
So, the probability when X is equal to 0 is 0.00525. If k is 1 then the probability is:
So, the probability when X is equal to 1 is 0.04875. If k is 2 then the probability is:
So, the probability when X is equal to 2 is 0.18115. If k is 3 then the probability is:
So, the probability when X is equal to 3 is 0.33642. If k is 4 then the probability is:
So, the probability when X is equal to 4 is 0.31239. If k is 5 then the probability is:
So, the probability when X is equal to 5 is 0.11603.
Software procedure:
Step-by-step procedure to obtain the probability histogram for the distribution of X using the MINITAB software:
- Choose Graph > Probability Distribution Plot choose View Single > Click OK.
- From Distribution, choose ‘Binomial’ distribution.
- Enter the Number of trials as 5 and Event probability as 0.65.
- Click OK.
- Output using the MINITAB software is given below:
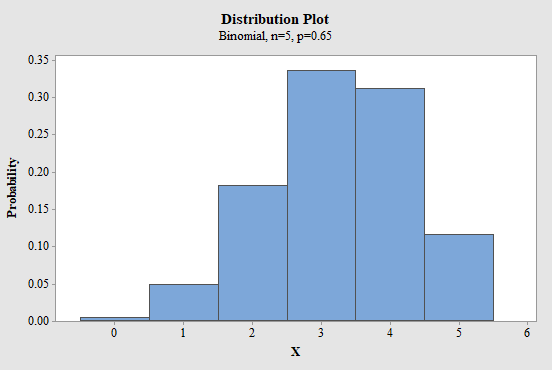
Figure-1
Conclusion:
The probabilities of each value of X are 0.00525, 0.04875, 0.18115, 0.33642, 0.31239 and 0.11603 for values of X as 0, 1, 2, 3, 4, and 5 respectively.
(d)
To calculate: The
To show: The location of the mean on the histogram.
(d)
Answer to Problem 14.25E
The mean of X is 3.25 and standard deviation of X is 1.1375.
Explanation of Solution
The binomial distribution formula is
Where, n is the number of trials, x is the number of successes among n trials, p is the probability of successes, and q is the probability of failure.
As given that X is a binomial probability distribution, so mean of X is calculated as:
Where
So, the mean of X is 3.25. Standard deviation of X is calculated as:
Where
So, the standard deviation of X is 1.1375. To show mean value on the histogram use the above histogram to show mean value of 3.25.

Figure-2
Conclusion:
The mean of X is 3.25 and standard deviation of X is 1.1375.
Want to see more full solutions like this?
Chapter 14 Solutions
Loose-leaf Version for The Basic Practice of Statistics 7e & LaunchPad (Twelve Month Access)

 MATLAB: An Introduction with ApplicationsStatisticsISBN:9781119256830Author:Amos GilatPublisher:John Wiley & Sons Inc
 Probability and Statistics for Engineering and th...StatisticsISBN:9781305251809Author:Jay L. DevorePublisher:Cengage Learning
 Statistics for The Behavioral Sciences (MindTap C...StatisticsISBN:9781305504912Author:Frederick J Gravetter, Larry B. WallnauPublisher:Cengage Learning
 Elementary Statistics: Picturing the World (7th E...StatisticsISBN:9780134683416Author:Ron Larson, Betsy FarberPublisher:PEARSON
 The Basic Practice of StatisticsStatisticsISBN:9781319042578Author:David S. Moore, William I. Notz, Michael A. FlignerPublisher:W. H. Freeman
 Introduction to the Practice of StatisticsStatisticsISBN:9781319013387Author:David S. Moore, George P. McCabe, Bruce A. CraigPublisher:W. H. Freeman