(a)
To find: The values of n and p, X has a binomial distribution.
(a)
Answer to Problem 14.25E
The value of n and p, if X has a binomial distribution is 5 and 0.25, respectively.
Explanation of Solution
Given info:
Yosemite National park has arranged the 5 high sierra camps
Justification;
Define the random variable X “the number of years that have been selected to hike the loop.
Also, there are two possible outcomes (groups that hike the loop and do not hike the loop) and the probability of success is the probability that the number of years that have been selected to hike the loop (p) is 0.25 and not selected to hike the loop is 0.75
Therefore, the number of years that have been selected to hike the loop follows the binomial distribution with sample size
Thus, the value of n and p, if X has a binomial distribution is 5 and 0.25, respectively.
(b)
To find: The possible values that X takes.
(b)
Answer to Problem 14.25E
The possible values that the random variable X take are 0, 1, 2, 3, 4 and 5.
Explanation of Solution
Since, the national park has arranged only the 5 high sierra camps, the possible values that (X) the number of years that have been selected to hike the loop takes are 0, 1, 2, 3, 4 and 5.
(c)
To find: The probability value for
To find: The probability value for
To find: The probability value for
To find: The probability value for
To find: The probability value for
To find: The probability value for
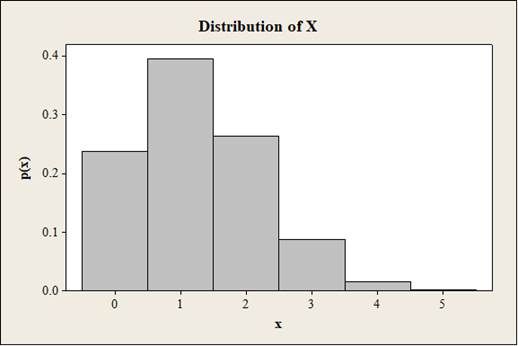
To obtain: The probability histogram for the distribution of X
(c)
Answer to Problem 14.25E
The probability value with
The probability value with
The probability value with
The probability value with
The probability value with
The probability value with
The probability histogram for the distribution of X is given below:
Explanation of Solution
Given info:
The probability value with
The binomial distribution formula is,
Substitute
Thus, the probability value with
The probability value with
The binomial distribution formula is,
Substitute
Thus, the probability value with
The probability value with
The binomial distribution formula is,
Substitute
Thus, the probability value with
The probability value with
The binomial distribution formula is,
Substitute
Thus, the probability value with
The probability value with
The binomial distribution formula is,
Substitute
Thus, the probability value with
The probability value with
The binomial distribution formula is,
Substitute
Thus, the probability value with
Software procedure:
Step-by-step procedure to obtain the probability histogram for the distribution of X is:
- Choose Graph > Bar Chart.
- From Bars represent, choose Values from a table.
- Under One column of values, choose Simple. Click OK.
- In Graph variables, enter the column of X as
- In Row labels, enter the column of P(X)
- Click OK.
Justification:
In the probability histogram, the values of X are taken along the horizontal axis, the probability values along the vertical axis, and the corresponding probability is represented by the height of the bars.
(d)
To find: The mean and the standard deviation of the distribution.
(d)
Answer to Problem 14.25E
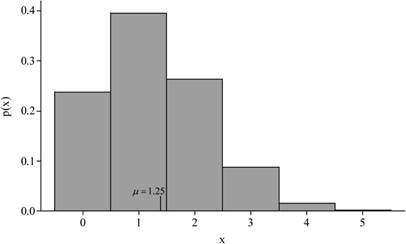
The mean and the standard deviation of the distribution is 1.25 years and 0.9682 years.
Explanation of Solution
Calculation:
Mean:
The mean is calculated by using the formula:
Substitute n as 5 and p as 0.25.
Thus, the mean of distribution is 1.25 years.
Standard deviation:
The standard deviation is calculated by using the formula:
Substitute n as 5, p as 0.25 and q as
Thus, the standard deviation of distribution is 1.2962 years.
From the part (c), by using the probability histogram for the distribution of X, the location of mean with 1.25 is marked on the histogram as follows:
Want to see more full solutions like this?
Chapter 14 Solutions
The Basic Practice of Statistics

 MATLAB: An Introduction with ApplicationsStatisticsISBN:9781119256830Author:Amos GilatPublisher:John Wiley & Sons Inc
 Probability and Statistics for Engineering and th...StatisticsISBN:9781305251809Author:Jay L. DevorePublisher:Cengage Learning
 Statistics for The Behavioral Sciences (MindTap C...StatisticsISBN:9781305504912Author:Frederick J Gravetter, Larry B. WallnauPublisher:Cengage Learning
 Elementary Statistics: Picturing the World (7th E...StatisticsISBN:9780134683416Author:Ron Larson, Betsy FarberPublisher:PEARSON
 The Basic Practice of StatisticsStatisticsISBN:9781319042578Author:David S. Moore, William I. Notz, Michael A. FlignerPublisher:W. H. Freeman
 Introduction to the Practice of StatisticsStatisticsISBN:9781319013387Author:David S. Moore, George P. McCabe, Bruce A. CraigPublisher:W. H. Freeman